Back

Forex market analysis: 28 April 2025

The euro has been moving within a narrow range as traders look ahead to a week of important economic data and US earnings reports. Key events like eurozone inflation and GDP figures, along with potential shifts in US stocks, could influence the currency’s next move.

Euro remains stuck in narrow range ahead of busy week

The euro remained firmly within a narrow trading range on Monday as currency traders prepared for a week filled with significant macroeconomic data and corporate earnings reports.

The EUR/USD pair dipped to USD 1.1344, continuing to hover around crucial technical levels without displaying a clear directional trend.

Chris Turner from ING highlighted that the European Central Bank’s upcoming inflation expectation survey, set to be released on Tuesday, could indicate easing price pressures.

However, the core inflation figures for April, due on Friday, may show a slight increase, which could complicate the outlook for monetary policy.

Adding to the cautious sentiment, the first-quarter GDP figures for the eurozone are expected on Wednesday. These numbers will provide a crucial insight into the region’s economic resilience amid growing global uncertainties.

In addition to the European data, earnings reports from major US corporations will take centre stage. High-profile companies like Amazon, Microsoft, Apple, and Meta are all scheduled to announce their results, and significant movements in the stock market could impact the foreign exchange markets.

Turner noted that US equities and the dollar have been positively correlated in recent times, meaning strong tech earnings could lead to a stronger dollar, even if it comes at the euro’s expense.

Technical analysis: EUR/USD shows limited movement

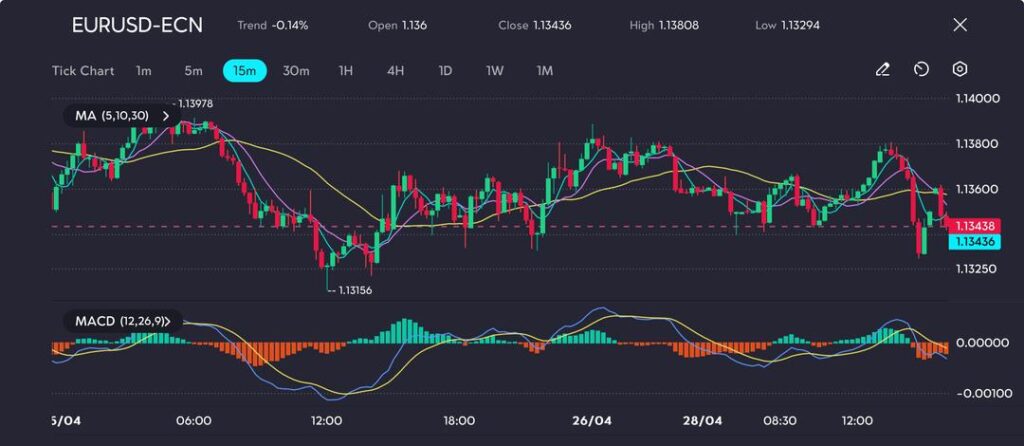
The EUR/USD pair has remained range-bound, trading between 1.13808 and 1.13156 in recent sessions.

Currently, it is hovering around 1.13436, following a sharp drop towards the lower end of the range.

The MACD momentum indicator is shifting into bearish territory, while the 5, 10, and 30-period moving averages are all pointing downward, signalling increasing downside pressure.

EUR/USD struggles to hold ground as downside pressure builds, with sellers testing key range support, as seen on the VT Markets app.

Despite several attempts to break higher, sellers have remained active around the 1.1380 level.

The inability to sustain gains, combined with steady compression near the middle of the range, suggests that a breakout could be imminent.

If the support at 1.1315 is breached, the pair may quickly test the 1.1290 level.

For the short term, the bias is neutral to bearish, unless buyers can reclaim the 1.1360 level with strong upward momentum.

Click here to open account and start trading.

Dividend Adjustment Notice – Apr 28 ,2025

Dear Client,

Please note that the dividends of the following products will be adjusted accordingly. Index dividends will be executed separately through a balance statement directly to your trading account, and the comment will be in the following format “Div & Product Name & Net Volume”.

Please refer to the table below for more details:

Dividend Adjustment Notice

The above data is for reference only, please refer to the MT4/MT5 software for specific data.

If you’d like more information, please don’t hesitate to contact info@vtmarkets.com.

Stock Market Opening and Closing Times Globally

Stock Market Trading Hours Around the World: Opening and Closing Times

In today’s fast-paced trading environment, understanding stock market trading hours is essential for maximizing trading opportunities. With exchanges operating across various time zones, traders have nearly constant access to markets. However, knowing the opening and closing hours of stock markets, especially in UK time (GMT), is crucial for planning trades effectively and optimizing results.

Imagine a London-based trader adjusting their positions at 2:30 PM GMT, just as the New York Stock Exchange (NYSE) opens, or an early riser catching key movements in Hong Kong before breakfast. Timing might not be everything, but it’s often the deciding factor between profitable trades and missed opportunities.

What Time Does the Stock Market Open and Close?

Here’s a detailed look at the stock market open times for the world’s 10 largest stock exchanges, all converted to UK time (GMT) for your convenience:

Stock ExchangeMarket Cap (Approximately)Local Trading HoursUK Time (GMT)Major Stock Indices 
London Stock Exchange (LSE)$4.1 trillion8:00 AM – 4:30 PM GMT8:00 AM – 4:30 PMFTSE 100, FTSE 250
New York Stock Exchange (NYSE)$30 trillion9:30 AM – 4:00 PM ET2:30 PM – 9:00 PMDow Jones Industrial Average (DJIA), S&P 500
NASDAQ$20 trillion9:30 AM – 4:00 PM ET2:30 PM – 9:00 PMNasdaq Composite, Nasdaq-100
Shanghai Stock Exchange (SSE)$7 trillion9:30 AM – 3:00 PM CST1:30 AM – 7:00 AMSSE Composite Index, SSE 50 Index
Euronext (Paris, Amsterdam, Brussels)$6.5 trillion9:00 AM – 5:30 PM CET8:00 AM – 4:30 PMCAC 40 (France), AEX (Netherlands), BEL 20 (Belgium)
Hong Kong Stock Exchange (HKEX)$5.7 trillion9:30 AM – 4:00 PM HKT1:30 AM – 8:00 AMHang Seng Index (HSI)
Tokyo Stock Exchange (TSE)$5.6 trillion9:00 AM – 3:00 PM JST12:00 AM – 6:00 AMNikkei 225, TOPIX
Shenzhen Stock Exchange (SZSE)$5 trillion9:30 AM – 3:00 PM CST1:30 AM – 7:00 AMSZSE Component Index, ChiNext Index
Bombay Stock Exchange (BSE)$3.8 trillion9:15 AM – 3:30 PM IST3:45 AM – 10:00 AMBSE Sensex (S&P BSE SENSEX)
National Stock Exchange of India (NSE)$3.7 trillion9:15 AM – 3:30 PM IST3:45 AM – 10:00 AMNIFTY 50

Global Stock Market Trading Hours: A Regional Breakdown

Understanding the trading hours of global stock exchanges is crucial for traders who want to stay ahead of the market. By knowing the trading hours in North America, Europe, Asia-Pacific, and South Asia, you can strategically plan your trades and optimize your market participation. Below, we break down the key stock market trading hours for the most prominent stock exchanges across these regions, helping you navigate global markets with confidence.

Trading Hours in North America

North America is home to some of the most influential stock exchanges in the world, including the New York Stock Exchange (NYSE) and NASDAQ, both located in the United States. The NYSA opening hours are from 9:30 AM to 4:00 PM ET (2:30 PM to 9:00 PM GMT), Monday through Friday. The NASDAQ opening hours are identical, providing a combined window of opportunity for traders looking to execute trades on either platform.

Both exchanges also offer extended hours trading between 4:00 PM and 8:00 PM ET (9:00 PM to 1:00 AM GMT), giving traders the chance to continue executing orders even after the official closing bell. However, trading outside regular hours comes with added risks, as lower market participation can result in decreased liquidity and potentially less favorable prices. After-hours trading on both exchanges primarily relies on automated systems to match buyers and sellers.

These exchanges close for public holidays, including significant dates like Thanksgiving (fourth Thursday of November), New Year’s Day (1 January), Independence Day (4 July), and President’s Day (third Monday of February), which can impact global trading volumes.

Trading Hours in Europe

Europe boasts two major stock exchanges: the London Stock Exchange (LSE) and Euronext, which operates across several countries including France, the Netherlands, and Belgium. The London Stock Exchange opening hours are from 8:00 AM to 4:30 PM GMT, providing a key trading window for European investors.

The Euronext opening hours are similar, operating from 9:00 AM to 5:30 PM CET (8:00 AM to 4:30 PM GMT). This exchange includes multiple countries, with Paris, Amsterdam, and Brussels being among the most prominent locations for European trading.

Public holidays like Christmas and New Year’s Day will see these exchanges close, along with Good Friday and Labour Day in many European countries, affecting liquidity and market movement.

Both exchanges provide ample opportunity for traders, with active periods during the day often seeing the highest trading volumes, especially between 8:00 AM and 10:00 AM GMT for the LSE, when traders react to global news and economic data.

Trading Hours in Asia-Pacific

The Asia-Pacific region is home to many important stock exchanges, including the Shanghai Stock Exchange (SSE), Hong Kong Stock Exchange (HKEX), Tokyo Stock Exchange (TSE), and Shenzhen Stock Exchange (SZSE). Each of these exchanges operates according to its local timezone but offers overlapping trading hours for a window of global market engagement.

The SSE opening hours are from 9:30 AM to 3:00 PM CST (1:30 AM to 7:00 AM GMT), with a break for lunch. HKEX trading hours are 9:30 AM to 4:00 PM HKT (1:30 AM to 8:00 AM GMT), providing key access to Chinese and Asian stocks, including well-known companies like Tencent and Alibaba.

Meanwhile, the TSE opening hours run from 9:00 AM to 3:00 PM JST (12:00 AM to 6:00 AM GMT), allowing access to major Japanese companies such as Toyota and Sony. Like the others in the region, SZSE operates from 9:30 AM to 3:00 PM CST (1:30 AM to 7:00 AM GMT).

Although markets in Asia close on public holidays like Chinese New Year and Obon in Japan, the region remains active and continues to play a crucial role in global market dynamics. Trading often peaks in the morning session before a lunch break, with lower activity resuming in the afternoon.

Trading Hours in South Asia

South Asia is represented by two major stock exchanges in India: the Bombay Stock Exchange (BSE) and the National Stock Exchange of India (NSE). Both exchanges offer trading from 9:15 AM to 3:30 PM IST (3:45 AM to 10:00 AM GMT), giving investors in India ample time to trade.

The BSE Sensex and NIFTY 50 are two key indices that reflect the performance of the Indian market, and they operate within these hours. Public holidays such as Diwali and Republic Day lead to the closure of these exchanges, often resulting in lower market participation during these periods.

How to Trade in the Stock Market

Once you know the opening times of stock market sessions worldwide, you can start planning your trading strategies more effectively. Here’s a simple step-by-step guide:

Step 1: Understand the Stock Market

Before diving into stock market trading, it’s important to have a solid understanding of how the market works. Familiarize yourself with concepts like stock prices, market indices, trading hours, and economic factors that influence the market.

Step 2: Choose a Reliable Broker

Selecting a trusted broker is key to successful trading. Ensure the broker offers the tools, platforms, and resources you need to trade confidently. Look for competitive spreads, low fees, and strong customer support.

Step 3: Open a Trading Account

Once you’ve chosen a broker, you’ll need to open a trading account. This involves providing personal details and financial information. Most brokers offer easy-to-use platforms for both beginners and experienced traders.

Step 4: Pick a Suitable Time and Strategy

Timing and strategy are critical in the stock market. Choose the right time based on market hours and liquidity. Develop a trading strategy that suits your risk tolerance, whether it’s day trading, swing trading, or long-term investing.

Step 5: Implement Risk Management Tools

To protect your investments, always use risk management tools such as stop-loss orders and take-profit levels. This helps limit potential losses and lock in profits, allowing for more controlled risk exposure.

Step 6: Stay Informed and Focused

Stay updated on market news, economic events, and the performance of your chosen stocks. Keeping informed will help you make timely decisions. Additionally, stay focused and disciplined to avoid emotional trading mistakes.

New to trading? Discover how to start trading for beginners.

Conclusion

Having a clear understanding of global stock market trading hours is essential for traders looking to maximize opportunities and minimize risks. By knowing the opening and closing hours of major exchanges across North America, Europe, Asia-Pacific, and South Asia, you can plan your trades more effectively and take advantage of high-liquidity periods. 

Whether you’re navigating the bustling markets of New York or Tokyo, or aligning your trading strategies with the trading hours in London or Mumbai, timing is a critical factor in your trading success. By staying informed and adjusting your approach according to regional market hours, you can ensure that you’re always one step ahead in the dynamic world of global trading.

Start Trading at the Right Time with VT Markets

At VT Markets, we provide traders with the tools they need to maximize stock market trading hours. Our platform ensures that you stay updated with the opening hours of stock markets worldwide. Whether you focus on the London Stock Exchange opening hours or plan your trades based on the New York Stock Exchange closing hours, we offer the flexibility and insights to help you succeed.

With access to real-time market data, fast execution, and competitive spreads, VT Markets empowers you to execute your trades during the most active and liquid times of the day. Whether you use MetaTrader 4 or MetaTrader 5, our platform ensures that your strategy thrives during key market hours, giving you a competitive edge.

Start trading with VT Markets today and take a smarter approach to navigating stock market opening and closing times, because timing is everything in trading.

Frequently Asked Questions (FAQs)

1. What time does the London Stock Exchange open?

The London Stock Exchange (LSE) opens at 8:00 AM GMT and closes at 4:30 PM GMT on weekdays.

2. What time does the NASDAQ Stock Exchange open?

The NASDAQ Stock Exchange opens at 9:30 AM ET, which is 2:30 PM GMT, and closes at 4:00 PM ET (9:00 PM GMT).

3. What time does the New York Stock Exchange open?

The New York Stock Exchange (NYSE) opens at 9:30 AM ET, or 2:30 PM GMT, and closes at 4:00 PM ET (9:00 PM GMT).

4. What time does the Hong Kong Stock Exchange (HKEX) open?

The Hong Kong Stock Exchange (HKEX) opens at 9:30 AM HKT, or 1:30 AM GMT, and closes at 4:00 PM HKT (8:00 AM GMT).

5. Can I trade after the market closes?

Yes, many exchanges offer after-hours trading. For instance, the NYSE and NASDAQ provide extended hours trading from 4:00 PM to 8:00 PM ET (9:00 PM to 1:00 AM GMT), but with reduced liquidity and potential risks.

6. How do market holidays affect trading hours?

Stock markets are closed on public holidays, such as Christmas, New Year’s Day, and Thanksgiving. This can lead to lower trading volumes and less market activity, affecting overall liquidity.

Week ahead: Market brace for Fed’s rate shakeup

During the week of 28 April to 2 May 2025, several key economic indicators and events are anticipated to influence financial markets, including crucial data on US labour market conditions, inflation, and GDP growth. Central bank decisions and global trade developments are also expected to drive volatility, with market participants closely monitoring policy shifts and economic outlooks from both the Federal Reserve and the European Central Bank.

KEY INDICATORS

Global trade and tariff developments

  • US media report that Trump is considering a tiered tariff system on China, according to CCTV.
  • The White House says Trump’s stance on China tariffs remains unchanged.
  • South Korea’s finance minister says a consensus has been reached with the US on tariffs, non-tariff barriers, economic security, investment cooperation, and monetary policy.
  • The White House NEC director says top-level tax negotiators are scheduled to meet next week.

Central bank signals and economic outlooks

  • Fed’s Harker says the central bank may cut rates in June if economic data become clearer.
  • Fed’s Waller says clarity on the economic impact of tariffs may emerge by July and rate cuts could follow if unemployment rises.
  • Atlanta Fed GDPNow estimates Q1 US GDP growth at -2.5%.
  • Fed’s Kashkari says constant announcements from Washington pose challenges for both policymakers and the public.
  • ECB Governing Council member Rehn says the central bank should not rule out the possibility of deeper rate cuts.
  • The ECB will hold a strategy meeting on 6–7 May to discuss a potential shift towards more flexible policies.

Economic data from the US and Germany

  • US initial jobless claims for the week ending 19 April were 222,000, in line with expectations.
  • US durable goods orders rose 9.2% month-on-month in March, the largest increase since July 2024.
  • The German government now forecasts 0% economic growth in 2025, down from a previous projection of +0.3%.
  • Germany’s inflation is projected to fall to 2.0% in 2025 and 1.9% in 2026.

MARKET MOVERS

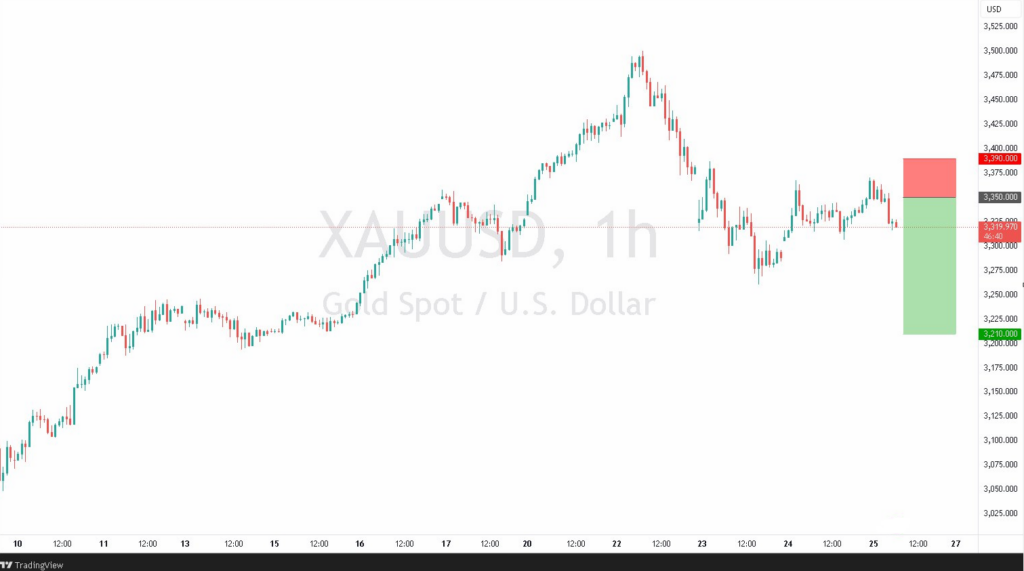
XAU/USD

  • Although the bulls are in control, the stalling positive momentum indicates a turnaround is possible.
  • While the bulls maintain control, fading upside momentum suggests a potential reversal.
  • A corrective move lower is anticipated.
  • A short-term bounce may occur before the next leg down.
  • Our preferred strategy is to sell into strength.
  • Key resistance is identified at 3,350.0.

Trade opportunity: Target 1: 3,210 / Target 2: 3,200.

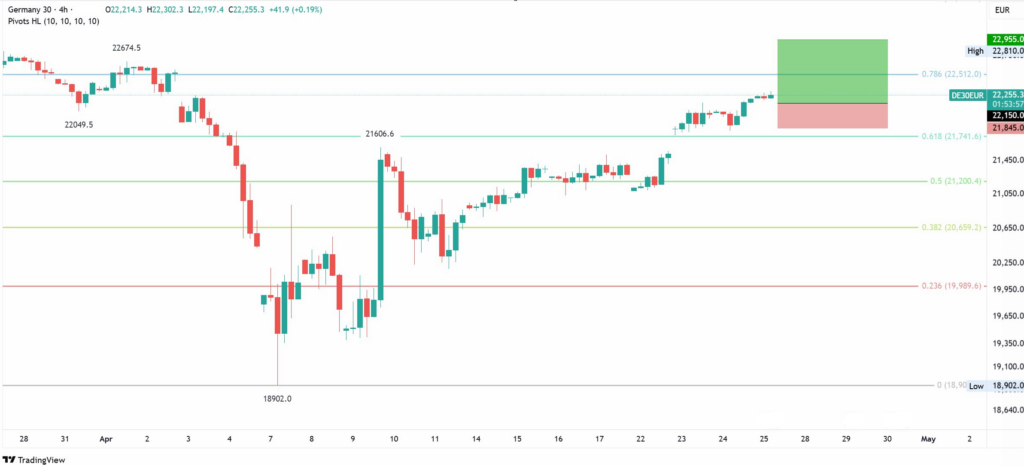
DAX40

  • Short-term bias has shifted to the upside.
  • The market has posted four consecutive daily gains.
  • There are no clear signs of exhaustion in the current uptrend.
  • An attractive risk/reward setup for initiating long positions at market.
  • The 20-period 1-hour EMA is currently positioned at 22,150.

Trade opportunity: Target 1: 22,955 / Target 2: 23,055.

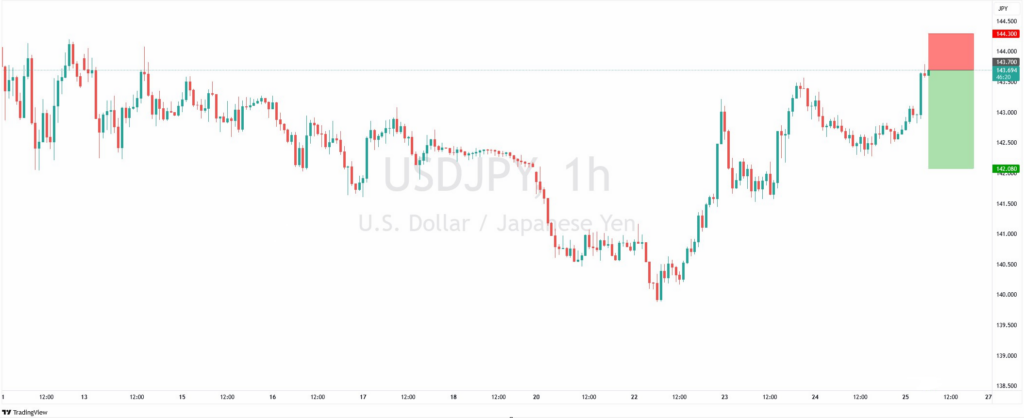
USD/JPY

  • Registered modest daily gains, though price action remained within the prior day’s range — forming an indecisive inside day.
  • Custom resistance is seen at 143.83.
  • The 261.8% Fibonacci extension (from 142.28 to 142.84) aligns at 143.71.
  • While the expected move lower is corrective in nature, it presents a compelling risk/reward opportunity today.
  • Medium-term bias remains neutral.

Trade opportunity: Target 1: 142.08 / Target 2: 141.50.

NEWS HEADLINES

US dollar weakens amid market adjustments

  • The US dollar eased after a two-day rebound, with the Dollar Index retreating to 99.30.
  • EUR/USD gained 80 pips, advancing to 1.1393.
  • USD/JPY declined 87 pips, settling at 142.57.
  • GBP/USD climbed 89 pips to 1.3344.
  • AUD/USD strengthened by 50 pips, reaching 0.6409.
  • USD/CHF edged down 39 pips to 0.8269.
  • USD/CAD slipped 37 pips, trading at 1.3843.

US stocks soar on strong earnings and economic data

  • US stocks rallied for a third consecutive session on Thursday.
  • Dow Jones rose 486 points (+1.23%) to 40,093.
  • S&P 500 gained 108 points (+2.03%) to 5,484.
  • Nasdaq 100 jumped 521 points (+2.79%) to 19,214.
  • Nvidia, Tesla, Microsoft, and Amazon each gained over 3%.
  • Alphabet rose 2.53% and surged over 4% after-hours following strong earnings and a USD 70bn buyback plan.
  • The US 10-year yield fell 7 basis points to 4.313%, continuing its decline.
  • Durable goods orders surged 9.2% in March (vs. +1.7% expected).
  • Existing home sales dropped 5.9% (vs. -1.9% expected), marking the steepest decline since late 2022.
  • European stock indices edged higher: DAX +0.47%, CAC 40 +0.27%, FTSE 100 +0.05%.
  • WTI crude rose USD 0.52 to USD 62.79/bbl.

Market reacts to Japan’s inflation and global moves

  • During the Asian session, USD/JPY rebounded to 142.95 after Tokyo CPI rose 3.5% year-on-year in April (vs. 3.1% expected).
  • EUR/USD pulled back to 1.1347, while GBP/USD slipped to 1.3305.
  • Gold rebounded USD 60 (+1.85%) to USD 3,349/oz, ending a two-day decline and holding steady around USD 3,348.

KEY ECONOMIC EVENTS

Traders should brace for a data-heavy week ahead, with key releases including US non-farm payrolls, ISM manufacturing and services PMIs, and Eurozone inflation figures—all of which could significantly shape market expectations around central bank policy moves. Stay alert for volatility, especially around labour market and inflation-related surprises.

Tuesday, 29 April

  • German Preliminary CPI (MoM): A critical indicator for assessing inflation trends in the Eurozone’s largest economy.
  • US CB Consumer Confidence: Provides insights into consumer sentiment and potential spending behaviours.

Wednesday, 30 April

  • US ADP Non-Farm Employment change: Offers an early look at private sector employment trends ahead of the official jobs report.
  • US Advance GDP (Q1): Initial estimate of economic growth for the first quarter, influencing market expectations.
  • US Core PCE Price Index (MoM): The Federal Reserve’s preferred inflation measure, critical for monetary policy decisions.
  • Bank of Japan monetary policy meeting (Day 1): Commencement of the BOJ’s two-day policy meeting, with potential implications for global markets.

Thursday, 1 May

  • Bank of Japan interest rate decision: Conclusion of the BOJ’s policy meeting, with announcements on interest rates and economic forecasts.
  • US ISM Manufacturing PMI: Measures manufacturing sector activity, a key indicator of economic health.
  • US Unemployment Claims: Weekly data on jobless claims, providing insights into labour market conditions.
  • Bank holidays: Markets in China, Switzerland, France, Germany, and Italy will be closed, potentially leading to reduced liquidity.

Friday, 2 May

  • US Non-Farm Payrolls (April): The most anticipated labour market report, influencing Federal Reserve policy and market sentiment.
  • US Unemployment Rate: Provides the overall unemployment figure, complementing the NFP data.
  • US Average Hourly Earnings (MoM): Indicates wage growth, a key factor in inflation and consumer spending.
  • Eurozone Flash CPI (YoY): Preliminary inflation data for the Eurozone, essential for ECB policy considerations.
  • Final Manufacturing PMI (Eurozone & UK): Final readings on manufacturing activity, reflecting economic momentum.

Click here to open account and start trading.

Into Tomorrow: VT Markets’ Next Chapter in Trading Innovation

Marking 10 years with exclusive initiatives throughout the year

28 April, 2025 – Sydney, Australia VT Markets, a leading multi-asset brokerage, is proud to celebrate its 10th year in the industry. Over the past decade, VT Markets has redefined the landscape of trading to deliver unmatched value to its customers. Looking to the future, VT Markets embraces the theme “Into Tomorrow,” symbolizing our commitment to the next stage of growth and transformation.

A Decade of Evolution and Growth

Since its inception, VT Markets is driven by a clear vision: to innovate and transform the way people trade. From the pioneering of cutting-edge trading technology to the expansion into global markets, VT Markets has always stayed ahead of the curve. The past decade has been a story of transformation—each milestone has played a pivotal role in shaping the company into its success today.

Into Tomorrow, Together

Looking ahead,  VT Markets is driven by a renewed sense of purpose. The theme “Into Tomorrow” symbolizes a journey toward the future and a commitment to navigating it with boldness, continually innovating, and reimagining what is possible. Over the next 2-3 years, VT Markets is poised for remarkable growth, with plans to expand its global reach, launch new cutting-edge products, and establish its foothold in emerging markets. The company is determined to explore uncharted territories, set new standards, and reshape the trading landscape, all while remaining true to its commitment to delivering exceptional value to its clients and partners.

“As VT Markets celebrates a decade of growth, we take pride in the foundation we’ve built—one rooted in innovation, trust, and a shared vision to transform the trading experience. This anniversary is a powerful reminder of our commitment to not only evolve as a brand, but to continuously set new benchmarks in the industry. Moving forward, we’re focused on expanding our impact, forging new paths, and delivering exceptional value for our clients and partners around the world.”

– Dandelyn Koh, Global Brand and PR Lead, VT Markets

Celebrating with Exclusive Initiatives

VT Markets first unveiled its 10th anniversary festivities to clients and partners during its Gala Dinner, ” A Billionaire’s Odyssey”, held in Bangkok, Thailand. To commemorate this monumental year, VT Markets will be launching a series of exciting initiatives throughout the year that will engage, inspire, and commemorate.

  • Global Trading Competition: An exciting trading competition inviting traders from around the world to showcase their skills and compete for incredible prizes, reinforcing VT Markets’ commitment to empowering traders at every level.
  • Limited-Edition Merchandise: Exclusive line-up of collectibles to celebrate with our community
  • Branded Content and Promotions: Attractive promotions, and exclusive offers for our community to celebrate the customers who have made this journey possible.
  • Commemorative Video: A tribute to VT Markets’ journey, showcasing key milestones and transformations.

These exciting launches will unfold progressively throughout the year, and details of each will be unveiled on vt10.com and VT Markets’ social media channels.

A Call to the Future

As VT Markets looks ahead, our way forward is of bold ambition, exploration, and innovation. Together, VT Markets will continue to push boundaries, reimagine possibilities, and create new opportunities for everyone it works with. Join us as we step boldly “Into Tomorrow.”

About VT Markets

VT Markets is a regulated multi-asset broker with a presence in over 160 countries as of today. It has earned numerous international accolades including Best Online Trading and Fastest Growing Broker. In line with its mission to make trading accessible to all, VT Markets offers comprehensive access to over 1,000 financial instruments and clients benefit from a seamless trading experience via its award-winning mobile application.

For more information, please visit the official VT Markets website or email us at info@vtmarkets.com. Alternatively, follow VT Markets on Facebook, Instagram, or LinkedIn.

For media enquiries and sponsorship opportunities, please email media@vtmarkets.com, or contact:

Dandelyn Koh 

Global Brand & PR Lead

dandelyn.koh@vtmarkets.com  

Brenda Wong 

Assistant Manager, Global PR & Communications

brenda.wong@vtmarkets.com 

Dividend Adjustment Notice – Apr 25 ,2025

Dear Client,

Please note that the dividends of the following products will be adjusted accordingly. Index dividends will be executed separately through a balance statement directly to your trading account, and the comment will be in the following format “Div & Product Name & Net Volume”.

Please refer to the table below for more details:

Dividend Adjustment Notice

The above data is for reference only, please refer to the MT4/MT5 software for specific data.

If you’d like more information, please don’t hesitate to contact info@vtmarkets.com.

Forex market analysis: 25 April 2025

Investor sentiment is being pulled in different directions as trade policy rumours and political statements shape expectations for inflation and interest rates. In this shifting landscape, markets are quick to react to any signals from policymakers, highlighting just how sensitive the bond market remains to both economic and geopolitical developments.

Nikkei 225 rallies as tech sentiment improves and yen eases

The Nikkei 225 finished the week on a strong note after a volatile midweek performance, fuelled by renewed optimism in Japan’s technology sector and easing concerns over currency fluctuations.

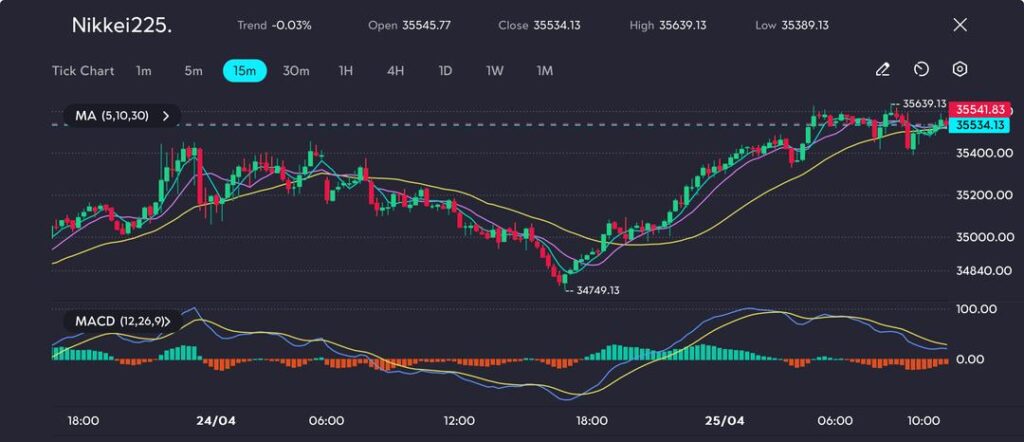
The index briefly touched an intraday high of 35,639.13 before settling slightly lower at 35,534.13, still delivering solid weekly gains.

Investor sentiment improved after former US President Donald Trump adopted a more moderate tone on tariffs, describing the ongoing trade conflict as “unsustainable.”

Although China rejected claims of renewed dialogue with the US, market participants redirected their attention to corporate earnings and the semiconductor sector’s prospects.

A weakening yen, retreating from a seven-month high, also lifted export-driven stocks. Traders were reassured by Japan’s Ministry of Finance, which signalled ongoing—but cautious—engagement with the US Treasury.

Technical outlook: Bullish momentum builds above key moving averages

Technically, the Nikkei 225 staged a strong rebound from the intraday low of 34,749.13, establishing a clear upward trajectory heading into 25 April.

Nikkei claws back from the dip, reclaiming structure above key moving averages as bulls eye the 36,000 zone, seen on the VT Markets app.

The price moved decisively above the 30-period moving average, with a series of bullish candles indicating continued upward momentum toward the 35,639.13 resistance zone.

Although the index encountered minor resistance at recent highs, the MACD histogram remains in positive territory, with both the MACD and signal lines holding a bullish crossover.

Additionally, the 5- and 10-period moving averages are positioned above the 30-period MA, reinforcing short-term trend strength.

Immediate support is seen around 35,200, while a confirmed breakout above 35,650 could pave the way for a push towards the psychological barrier at 36,000.

Recent sideways movement in price suggests consolidation rather than reversal, with potential for a continuation of the current uptrend.

Click here to open account and start trading.

Using economic calendar to trade in 2025: A beginner’s guide

Want to trade smarter in 2025? Economic calendars are your secret weapon. These tools flag market-moving events—like Federal Reserve rate calls or US jobs data—that can spark big price swings.

VT Markets’ economic calendar makes it easy for beginners to stay ahead, no economics degree needed. With US-China trade talks and central bank moves driving volatility, now’s the time to learn. Think of it as your trading GPS for 2025’s wild markets.

This guide covers what economic calendars are, how to use VT Markets’ tool, smart trading strategies, and pitfalls to dodge. Let’s dive in!

What is an economic calendar and why it matters in 2025

An economic calendar is a schedule of events that shake financial markets, such as interest rate decisions, inflation reports, and employment figures. Each entry lists the event’s name, date, time, affected currency, and impact level—high, medium, or low. For example, a US non-farm payrolls report, marked high-impact, can jolt USD pairs like USD/JPY.

In 2025, calendars are essential. US-China trade tensions, with tariff talks sparking currency swings, demand attention. Central banks, like the Federal Reserve and Bank of England, are tackling inflation, with recent US policy debates adding fuel. Emerging markets, like Australia’s AUD, tie to China’s moves.

Economic calendar keeps you prepared. For instance, a trader spotting a high-impact US CPI release might brace for USD/JPY volatility, planning trades to avoid rash decisions.

How to access and interpret VT Markets’ economic calendar

Accessing a reliable economic calendar is easy with VT Markets. Our free calendar, on the VT Markets website and mobile app, offers real-time updates and custom alerts. The tool excels with its simple, beginner-friendly filters, helping you focus on key events.

Interpreting it is simple. Each event lists the name (e.g., “US Federal Reserve Interest Rate Decision”), date, time, currency, and impact level. High-impact events, like Federal Reserve decisions, drive big moves; medium-impact ones, like UK retail sales, are milder; low-impact events, like regional surveys, barely shift markets. Expected versus actual data triggers reactions—a stronger US jobs report might lift USD/JPY.

To use VT Markets’ calendar, filter for high-impact events or currencies (e.g., USD for USD/JPY trades). Set alerts for 2025 events, like the US Federal Reserve’s 10 June rate decision. Check time zones—US releases at 8:30 AM EST are 1:30 PM GMT. A trader might filter for USD events, planning a USD/JPY trade.

Trading with economic calendars: Strategies for 2025

Using VT Markets’ economic calendar to trade in 2025 is about preparation and discipline. Here’s how to get started:

  • Plan your week: Every Sunday, review VT Markets’ calendar for high-impact events. In 2025, focus on major releases like US non-farm payrolls, Eurozone GDP, or China’s trade data. These events drive significant market moves.
  • Choose your market: Match events to markets. Trade USD pairs (e.g., USD/CAD) for US jobs reports, FTSE 100 stocks for UK data, or gold for inflation news. VT Markets’ calendar clearly shows affected currencies, simplifying your choice.
  • Trade cautiously: Economic releases cause volatility, so use low leverage (e.g., 5:1) to manage risk. Set stop-losses—say, 10 pips below your entry for EUR/USD—to limit losses. Beginners should avoid trading during releases and instead trade post-release trends when markets stabilise.
  • Practice first: Use VT Markets’ demo account to simulate trades. For example, test GBP/USD trades during a UK inflation release to build confidence without risking capital.

Consider this example: A trader checks VT Markets’ calendar and sees a US non-farm payrolls release on 7 March 2025. Expecting strong data, they buy USD 1,000 of USD/JPY at 150.00, setting a 10-pip stop-loss. The pair rises to 150.20 (20 pips) after a robust report, earning USD 13, while the stop-loss caps risk at USD 6.50.

This disciplined approach, guided by VT Markets’ calendar, turns news into opportunity. In 2025, events like Federal Reserve rate decisions or US tariff updates will offer similar chances to profit.

Avoiding pitfalls when using economic calendars

While VT Markets’ economic calendar is a powerful tool, beginners can trip up if they are not careful. Here are common mistakes and how to avoid them:

  • Overtrading low-impact events: Minor releases, like regional economic surveys, rarely move markets. Stick to high-impact events, like Federal Reserve rate announcements, using VT Markets’ impact filter to stay focused.
  • Misreading time zones: A US CPI release at 8:30 AM EST might confuse GMT users. VT Markets’ calendar automatically adjusts for your time zone, so double-check settings to avoid missing events.
  • Trading during volatility: High-impact releases cause erratic price swings. Instead of trading during a US jobs report, wait for trends to emerge. VT Markets’ demo account lets you practice safely.
  • Skipping risk management: Without stop-losses, a surprise ECB rate cut could cost 5% of your capital. Always set stops, like 10 pips for forex trades, to protect your account.

For example, a trader ignores VT Markets’ impact filter and trades AUD/USD during a low-impact Australian report, losing USD 50 on small moves. By refocusing on high-impact US data, they avoid unnecessary losses. In 2025, with volatility expected from US policy shifts and trade tensions, these precautions are critical.

Conclusion

In 2025, VT Markets’ economic calendar is your key to navigating the trading world with confidence. By helping you anticipate market-moving events, plan strategic trades, and manage risks, it levels the playing field for beginners.

With global markets buzzing from Federal Reserve decisions, US-China trade talks, and Bank of England policies, there’s no better time to start. Begin by exploring VT Markets’ calendar on our platform or app, filtering for high-impact events like the next US jobs report. Practice on a demo account to build skills, then take the leap.

Ready to trade 2025’s biggest market events? Open a live account with VT Markets to access our powerful economic calendar and start trading with confidence. Your journey to smarter trading begins now—let VT Markets guide you every step of the way.

Notification of Server Upgrade – Apr 24 ,2025

Dear Client,

As part of our commitment to provide the most reliable service to our clients, there will be maintenance this weekend.

Maintenance Details:

Notification of Server Upgrade

Please note that the following aspects might be affected during the maintenance:
1. The price quote and trading management will be temporarily disabled during the maintenance. You will not be able to open new positions, close open positions, or make any adjustments to the trades.

2. There might be a gap between the original price and the price after maintenance. The gaps between Pending Orders, Stop Loss, and Take Profit will be filled at the market price once the maintenance is completed. It is suggested that you manage the account properly.

The above data is for reference only. Please refer to the MT4/MT5 software / VT App for the specific maintenance completion and marketing opening time.

Thank you for your patience and understanding about this important initiative.

If you’d like more information, please don’t hesitate to contact info@vtmarkets.com.

Risk-Reward Ratio: What It Is & Why It Matters?

Understand What the Risk and Reward Ratio Is 

In this article, you will learn what the risk and reward ratio is, why it matters in trading, and how to use it to make smarter decisions in the financial markets. We will explore how to measure risk, how to manage it effectively, and what types of trading risks you need to watch out for. You’ll also discover common mistakes to avoid and how to develop a practical risk-reward strategy. Whether you are new to trading or looking to refine your approach, this guide provides the clarity and tools you need to trade with confidence.

What is Risk and Reward?

Before diving into ratios and strategies, it’s essential to understand that risk and reward together represent the potential loss and potential gain of any trade, forming the foundation of every sound trading decision. Every time a trader opens a position, they are weighing the downside they are willing to accept against the upside they hope to achieve.

What is Risk?

Risk is the possibility of losing capital on a trade. It refers to the amount a trader is prepared to lose if the market moves against their position. Managing risk involves setting clear boundaries, such as using stop-loss orders, to prevent losses from exceeding a predefined level. In trading, accepting risk is inevitable, but controlling it is a skill.

Example: If you enter a trade with a stop-loss 15 points below your entry, you are risking the dollar value of those 15 points. If each point equals $10, your total risk is $150.

What is Reward?

Reward is the potential profit a trader aims to earn if the market moves in their favour. It is defined by the take-profit level, which is set based on how far the trader expects the price to rise or fall. The reward should be realistic, and ideally, it should outweigh the risk involved.

Example: If you set a take-profit target that would return $450 in potential gains, while your risk remains at $150, your potential reward is three times your risk. This gives you a 1:3 risk and reward ratio.

Understanding how risk and reward work together helps traders make informed choices, maintain discipline, and build strategies that are sustainable over time.

Why Is Risk and Reward Important in Trading?

Every trading decision involves a level of uncertainty. While gains are the goal, losses are always a possibility. This is where the concept of risk and reward becomes essential. Understanding the balance between potential loss and expected profit allows traders to make more informed and calculated decisions.

The risk-reward ratio helps traders stay disciplined, plan their trades more effectively, and avoid emotional decision-making. Whether you are a beginner or a seasoned trader, maintaining a consistent approach to managing your r/r ratio can significantly improve your long-term trading results.

New to trading? Learn how to start trading as a beginner.

What Is the Risk and Reward Ratio?

The risk and reward ratio, commonly known as the R/R ratio or RR ratio, is a fundamental concept in trading that compares how much you are willing to risk on a trade to how much you expect to gain. It helps traders evaluate whether a trade is worth taking based on potential outcomes. This ratio is especially useful for planning trades and maintaining long-term profitability.

A good risk and reward ratio ensures that even if you lose more trades than you win, your profitable trades are large enough to cover the losses. It encourages traders to focus on high-quality setups where the potential reward justifies the risk taken.

Example: Imagine you’re trading a stock currently priced at $50. You decide to set your stop-loss at $48, meaning you’re risking $2 per share. Your take-profit level is set at $56, which gives you a potential gain of $6 per share. In this case, your risk-reward ratio is 1:3, because you are risking $2 to make $6. Even if you only win one out of every three trades, you could still break even or make a profit if your losses remain controlled.

Many experienced traders aim for a 1:2 or 1:3 ratio, striking a balance between realistic targets and disciplined risk management. A consistent and favorable R/R ratio plays a key role in successful trading over the long term.

How to Manage Risk

Risk management is more than just limiting losses. It’s about creating a structured approach that helps you stay consistent, disciplined, and prepared for various market conditions. Here are key ways to manage risk effectively:

Using stop-loss and take-profit orders

Stop-loss and take-profit orders are essential tools that allow you to automate exits. A stop-loss limits your downside by closing a trade once a predefined loss level is hit. A take-profit ensures you lock in gains once the price reaches your target. This automation removes emotional decision-making and keeps your trades aligned with your intended risk-reward ratio.

Following a well-defined trading plan

A trading plan acts as your roadmap, outlining when and how you enter trades, how much you risk, and your risk-reward ratio goals. It helps prevent impulsive actions and ensures you operate within a consistent framework. Traders who follow a structured plan are more likely to remain disciplined, avoid emotional bias, and build long-term stability.

Implementing hedging strategies

Hedging helps reduce potential losses by opening a second position that moves in the opposite direction of your main trade. For example, if you are long on a currency pair and market uncertainty rises, you might open a smaller short position on a related asset to offset exposure. While it won’t eliminate losses entirely, hedging can soften the impact of adverse moves and provide a safety net during high-risk periods.

Avoiding overtrading during high volatility

High market volatility may seem like an opportunity, but it can quickly lead to impulsive decisions and overexposure. Overtrading often results in inconsistent risk levels and emotional stress. The best approach is to be patient, wait for clear setups that meet your criteria, and avoid forcing trades simply because the market is moving.

Types of Investment and Trading Risk

Every financial market involves risk, but not all risks are the same. Understanding the various types of risk can help traders make better decisions and adjust their trading strategies, including their risk-reward ratio, to suit different conditions. Below are the most common types of investment and trading risk:

Market Risk

Market risk refers to the possibility of losses due to price fluctuations caused by macroeconomic factors such as interest rate changes, inflation data, or geopolitical events. For example, a sudden policy shift by a central bank can lead to large, unexpected price swings. This type of risk is always present and cannot be avoided, but it can be managed with proper stop-loss placement and position sizing.

Liquidity Risk

Liquidity risk occurs when you are unable to buy or sell an asset quickly without significantly affecting its price. This often happens in thinly traded markets or during off-hours. If you cannot exit a trade at your desired level, you might face slippage or be forced to accept a worse price. Traders can reduce this risk by focusing on highly liquid assets and avoiding oversized positions.

Leverage Risk

Leverage amplifies both gains and losses. While it allows you to control larger positions with less capital, it also increases your exposure to market moves. A small price fluctuation can lead to significant losses if your trade is over-leveraged. Managing this risk means using leverage cautiously and ensuring that your account can absorb potential losses without being wiped out.

Systematic Risk

Systematic risk, also known as market-wide or systemic risk, affects entire sectors or economies and cannot be mitigated through diversification. Examples include financial crises, pandemics, or global recessions. While this risk cannot be eliminated, it can be accounted for in your strategy by reducing exposure during high-uncertainty periods and maintaining a strong risk-reward ratio.

Emotional Risk

Emotional risk arises from impulsive decisions driven by fear, greed, or overconfidence. Even a strong strategy can fail if the trader abandons it in moments of stress. This type of risk is especially common during high volatility or after a series of losses. Managing emotional risk involves following a trading plan, setting predefined rules, and reviewing your trades regularly to stay objective.

Discover the difference between trading and investing.

Common Mistakes to Avoid

Even well-researched strategies can fall apart if traders ignore risk management principles. Recognising and avoiding these common mistakes is essential to protect your capital and improve your long-term results.

Ignoring the risk-reward ratio entirely

Some traders enter positions without assessing whether the potential reward justifies the risk. Skipping this evaluation leads to inconsistent outcomes and poor trade selection. A solid r/r ratio acts as a filter to eliminate low-quality setups.

Risking too much capital on a single trade

Overexposing your account to a single position increases the chance of a major loss. Even one bad trade can significantly damage your account if you exceed your risk limits. Many experienced traders risk only 1 to 2 percent of their account per trade to stay protected.

Letting emotions override your plan

Emotional decisions, such as revenge trading after a loss or chasing a winning streak, often lead to unnecessary risks. Sticking to your trading plan and risk management rules helps you stay objective even when the market becomes unpredictable.

Setting unrealistic reward targets

Expecting every trade to deliver a huge profit can lead to missed opportunities or holding onto positions too long. A realistic and consistent risk-reward ratio, such as 1:2 or 1:3, helps you focus on high-probability trades with reasonable profit potential.

Moving stop-losses out of fear of taking a loss

Adjusting your stop-loss just to avoid closing a losing trade often results in larger losses. Stop-losses should be based on logic, not emotions. Respecting your predefined risk level is a key part of disciplined trading.

Conclusion

The risk and reward ratio is one of the most important tools a trader can use. It provides a clear framework for evaluating opportunities and helps you stay focused on long-term success rather than short-term wins. By using the r/r ratio effectively, you can take control of your trading decisions and reduce the impact of losing trades. A profitable strategy is not about winning every time. It is about managing losses smartly and ensuring your winners are large enough to cover the inevitable losers.

Manage Your Risk and Reward with VT Markets

At VT Markets, we support traders with tools designed to manage both risk and reward efficiently. Our platform allows you to set stop-loss and take-profit levels easily, track your performance, and access a range of assets across global markets.

Whether you use MetaTrader 4 or MetaTrader 5, you can measure and control your r/r ratio with precision. Our fast execution, transparent pricing, and low spreads ensure that your strategy has the environment it needs to succeed.

Start trading with VT Markets today and take a smarter approach to risk-reward management.

Frequently Asked Questions (FAQs)

1. What is a reward in trading?

Reward is the potential profit a trader expects to gain from a trade if the market moves in their favour. It is typically defined by a take-profit level, which marks the price at which the position will be closed to secure gains.

2. What is risk in trading?

Risk is the potential loss a trader is willing to accept on a trade. It is often controlled using a stop-loss order, which closes a position automatically once the market moves against the trade by a certain amount.

3. What is the risk and reward ratio?

The risk and reward ratio, also known as the r/r ratio or rr ratio, compares the amount a trader risks to the potential reward. For example, a 1:3 ratio means risking $100 to potentially earn $300. It is a key tool for evaluating trade quality and managing long-term profitability.

4. What is a good risk-to-reward ratio for new traders?

A 1:2 or 1:3 risk-to-reward ratio is a solid starting point. This ensures that your potential profits outweigh your potential losses.

5. Is a higher risk-reward ratio always better?

Not necessarily. While a 1:4 or 1:5 ratio may seem attractive, trades with very high reward expectations are often harder to achieve. Sometimes a 1:2 or 1:3 ratio offers a more realistic balance between risk and probability of success. The key is to stay consistent and align your ratio with your trading style and win rate.

6. How do I calculate my r/r ratio?

Divide the amount you risk (entry price minus stop-loss) by your expected reward (take-profit minus entry price). Express the result as a ratio, such as 1:2 or 1:3.

Back To Top
Chatbots