The Swiss President, Keller-Sutter, has indicated intentions for Switzerland to forge a deal with the United States. She expressed optimism about negotiations, noting the U.S.’s willingness to customise agreements with individual countries. Although tariffs remain paused, the U.S. is keen to expedite discussions.
Switzerland, unlike some countries, does not offer subsidies to its industries. Keller-Sutter revealed that Switzerland now belongs to a select group of nations that undergo faster negotiation processes. This position holds interest for the U.S., particularly concerning how other countries subsidise their industries.
Recent Trade History
Historically, Switzerland has experienced a trade surplus with the U.S., resulting in a 31% tariff on Swiss imports. This rate has been temporarily lowered to 10% until July 8. Excluding gold from trade data significantly reduces the trade surplus between the two nations. Discussions involving gold were pivotal when Switzerland engaged with former President Trump regarding agreements with the U.K.
What we see here is a shift in diplomatic and trade dynamics between Switzerland and the United States, driven, in part, by mutual interest and a broader backdrop of resetting tariff structures. Keller-Sutter’s references to accelerated negotiating timelines suggest that Switzerland is now perceived as a more efficient counterpart when it comes to trade deal formulation. That reflects not only administrative effectiveness but also the relatively uncomplicated nature of its trade framework, owing to the lack of direct industrial subsidies.
This development matters especially because the United States has already signalled — through policy and precedent — a readiness to tailor its trade terms depending on the partner. It doesn’t treat all countries alike, and that opens a window for countries like Switzerland to press for more favourable terms, particularly around tariff levels. We note that a previous 31% rate on Swiss goods has been relaxed to 10% in the short term. But that reduction isn’t set in stone. It’s valid through early July, and there’s an implied understanding that its extension will be tied directly to the progress made in talks.
Now, when gold is stripped from trading figures, the previous trade surplus shrinks considerably, presenting a more balanced picture. That changes the footing for current talks. During earlier discussions under Trump, bringing gold into the conversation helped alter how deficits or surpluses were interpreted — politically and economically. This precedent is likely informing current thinking among negotiators, even if the players involved have changed.
Market Implications And Strategy
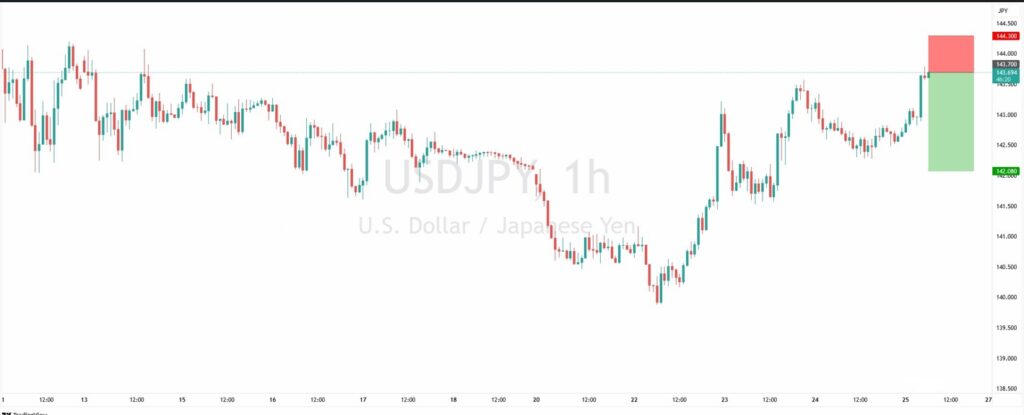
For those of us monitoring market fluctuations through the derivatives lens, this pause in tariff pressure offers some temporary breathing room. It’s not without caveats, though. If negotiations stall or if fresh data skews favour towards one side, there’s a risk that tariffs revert. That would be priced rapidly by markets.
Over the next few weeks, we should monitor signal variables — like goods trade breakdowns, especially metal categories, along with any unexpected shifts in import or export permits. Doing so will give a better steer on whether negotiators are moving toward an extension of the lower rate or preparing to let it expire.
Additionally, margin strategies across assets like industrial inputs and niche exporters may need to be rebalanced, particularly around mid-June when pre-deadline sentiment tends to shape options pricing. Watch closely for announcements around ‘technical talks’ — even minor ones. In previous cycles, such leaks have led to repricing within hours.
One thing is clear: if the broader trade narrative escalates or de-escalates, we won’t have long to react. Timing matters more than ever right now, not just in positioning but in response cadence. It’s not about guessing outcomes, but recognising how narrow the reaction windows are becoming.