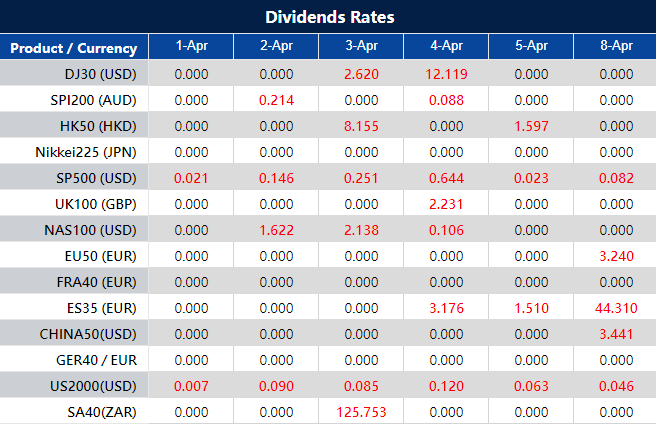
Please note that the dividends of the following products will be adjusted accordingly. Index dividends will be executed separately through a balance statement directly to your trading account, and the comment will be in the following format “Div & Product Name & Net Volume ”.
Please refer to the table below for more details:
The above data is for reference only, please refer to the MT4/MT5 software for specific data.
If you’d like more information, please don’t hesitate to contact info@vtmarkets.com.
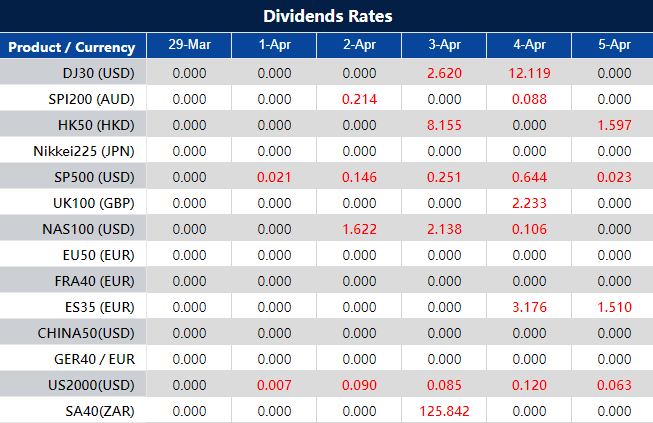
As the world’s economies continue to navigate the post-pandemic landscape, key indicators from the United States, Switzerland, and Canada offer insights into the ongoing recovery and challenges faced by various sectors. The upcoming weeks are set to deliver pivotal data on services sector performance, inflation rates, and employment changes that will shed light on the economic direction of these countries. Below, we delve into the specifics of each report and what analysts are anticipating.
U.S. ISM Services PMI Takes a Slight Dip
In the United States, the Institute for Supply Management (ISM) Services Purchasing Managers’ Index (PMI) saw a slight decline to 52.6 in February 2024, down from a four-month peak of 53.4 in January. This metric is crucial as it reflects the health of the services sector, which constitutes a significant portion of the U.S. economy. The anticipated PMI for March, set to be unveiled on 2 April 2024, is expected to hold steady at 52.6, signaling continued expansion in the services sector, albeit at a tempered pace.
Switzerland’s Inflation Rate on the Rise
Moving to Europe, Switzerland reported an uptick in its inflation rate to 0.6% in February 2024, a significant jump from the 0.2% recorded in the preceding month. This increase was primarily driven by higher costs for housing rentals and air transport. Analysts are closely watching the Swiss economy and forecast a further inflation rise of 0.3% for March 2024, with the official figures scheduled for release on 4 April 2024. This gradual increase in inflation could signal a strengthening consumer demand and economic activity in the country.
Canadian Employment Figures Show Growth
In Canada, the employment landscape showed positive momentum with the addition of 40.7K jobs in February 2024, an improvement over the 37.3K jobs added in January. However, the unemployment rate edged higher to 5.8% in February, up from 5.7% the month before. The focus now turns to the March 2024 employment report, expected on 5 April 2024. Analysts predict a more modest job growth of 25K, with unemployment anticipated to tick slightly higher to 5.9%. These figures suggest that while the job market remains robust, it faces headwinds that could moderate growth.
U.S. Job Market Shows Resilience Amidst Challenges
Lastly, the U.S. job market continued to demonstrate resilience with the economy adding 275K jobs in February 2024, surpassing the revised figure of 229K in January. Despite this strong job growth, the unemployment rate increased to 3.9%, the highest level since January 2022. Looking ahead to March 2024, analysts are forecasting the addition of 200K jobs, with the unemployment rate expected to remain steady at 3.9%. The upcoming jobs report, due on 5 April 2024, will be crucial in assessing whether the U.S. labor market can sustain its momentum amidst economic uncertainties.
As these economic indicators unfold, they will provide valuable insights into the health and trajectory of the global economy. Stakeholders, from policymakers to investors, will be watching closely to gauge the effectiveness of current economic policies and to strategize for the future amidst a landscape of ongoing challenges and opportunities.
Euro Market Sentiment Overview: Market sentiment analysis for EUR/USD, EUR/GBP, EUR/JPY.
Popularity in Trading: Trading can appear as a popularity contest; discerning traders find value in contrarian approaches.
IG Client Sentiment as a Contrarian Indicator: This tool provides insights into market sentiment, helping to identify potential opportunities to go against the mainstream trend.
Sentiment Analysis for EUR/USD:
Retail traders are significantly bullish on EUR/USD, with 60.78% taking long positions.
The long-to-short ratio stands at 1.55 to 1.
There’s been a notable increase in long positions (up 3.99% from yesterday and 35.69% from last week), while short positions have seen a significant decrease.
Contrarian Interpretation: The strong bullish sentiment on EUR/USD may indicate a contrarian signal for a potential decline in the near term.
Combining Strategies for Trading: Contrarian indicators are most effective when used as part of a comprehensive strategy that includes technical and fundamental analysis.
Top of Form
STOCK MARKET:
S&P 500 Record High: Closed the first quarter of 2024 with a record, marking its best performance since 2019.
Market Performance: The S&P 500 and Dow Jones both increased by more than 0.1%, while the Nasdaq slipped by 0.1%.
Consistent Growth: All three major stock averages have risen for five consecutive months.
Quarterly Closure: With markets closing for Good Friday, Thursday was the final trading day of the quarter.
Broadening Rally: Initially driven by megacap stocks, the market rally is now expanding more broadly.
Wall Street Targets: Firms are raising their year-end price targets for the S&P 500 due to its strong performance.
Economic Growth Data: Fourth quarter GDP growth was revised up to 3.4% from 3.2%.
Employment Figures: Initial jobless claims were slightly below estimates at 210,000 for the last week.
Upcoming Key Data: Investors are awaiting the PCE price index, the Federal Reserve’s favored measure of inflation.
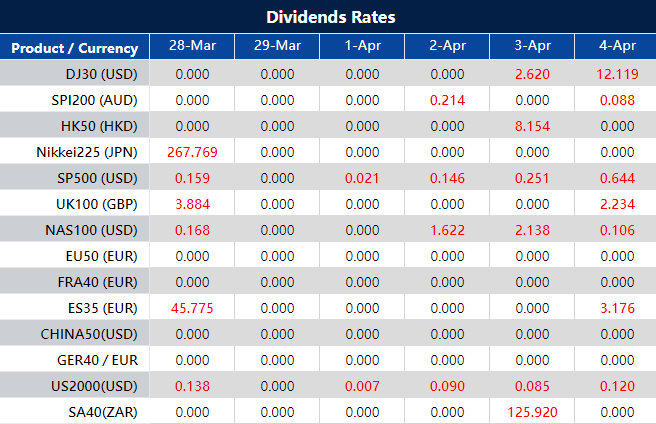
Please note that the dividends of the following products will be adjusted accordingly. Index dividends will be executed separately through a balance statement directly to your trading account, and the comment will be in the following format “Div & Product Name & Net Volume ”.
Please refer to the table below for more details:
The above data is for reference only, please refer to the MT4/MT5 software for specific data.
If you’d like more information, please don’t hesitate to contact info@vtmarkets.com.
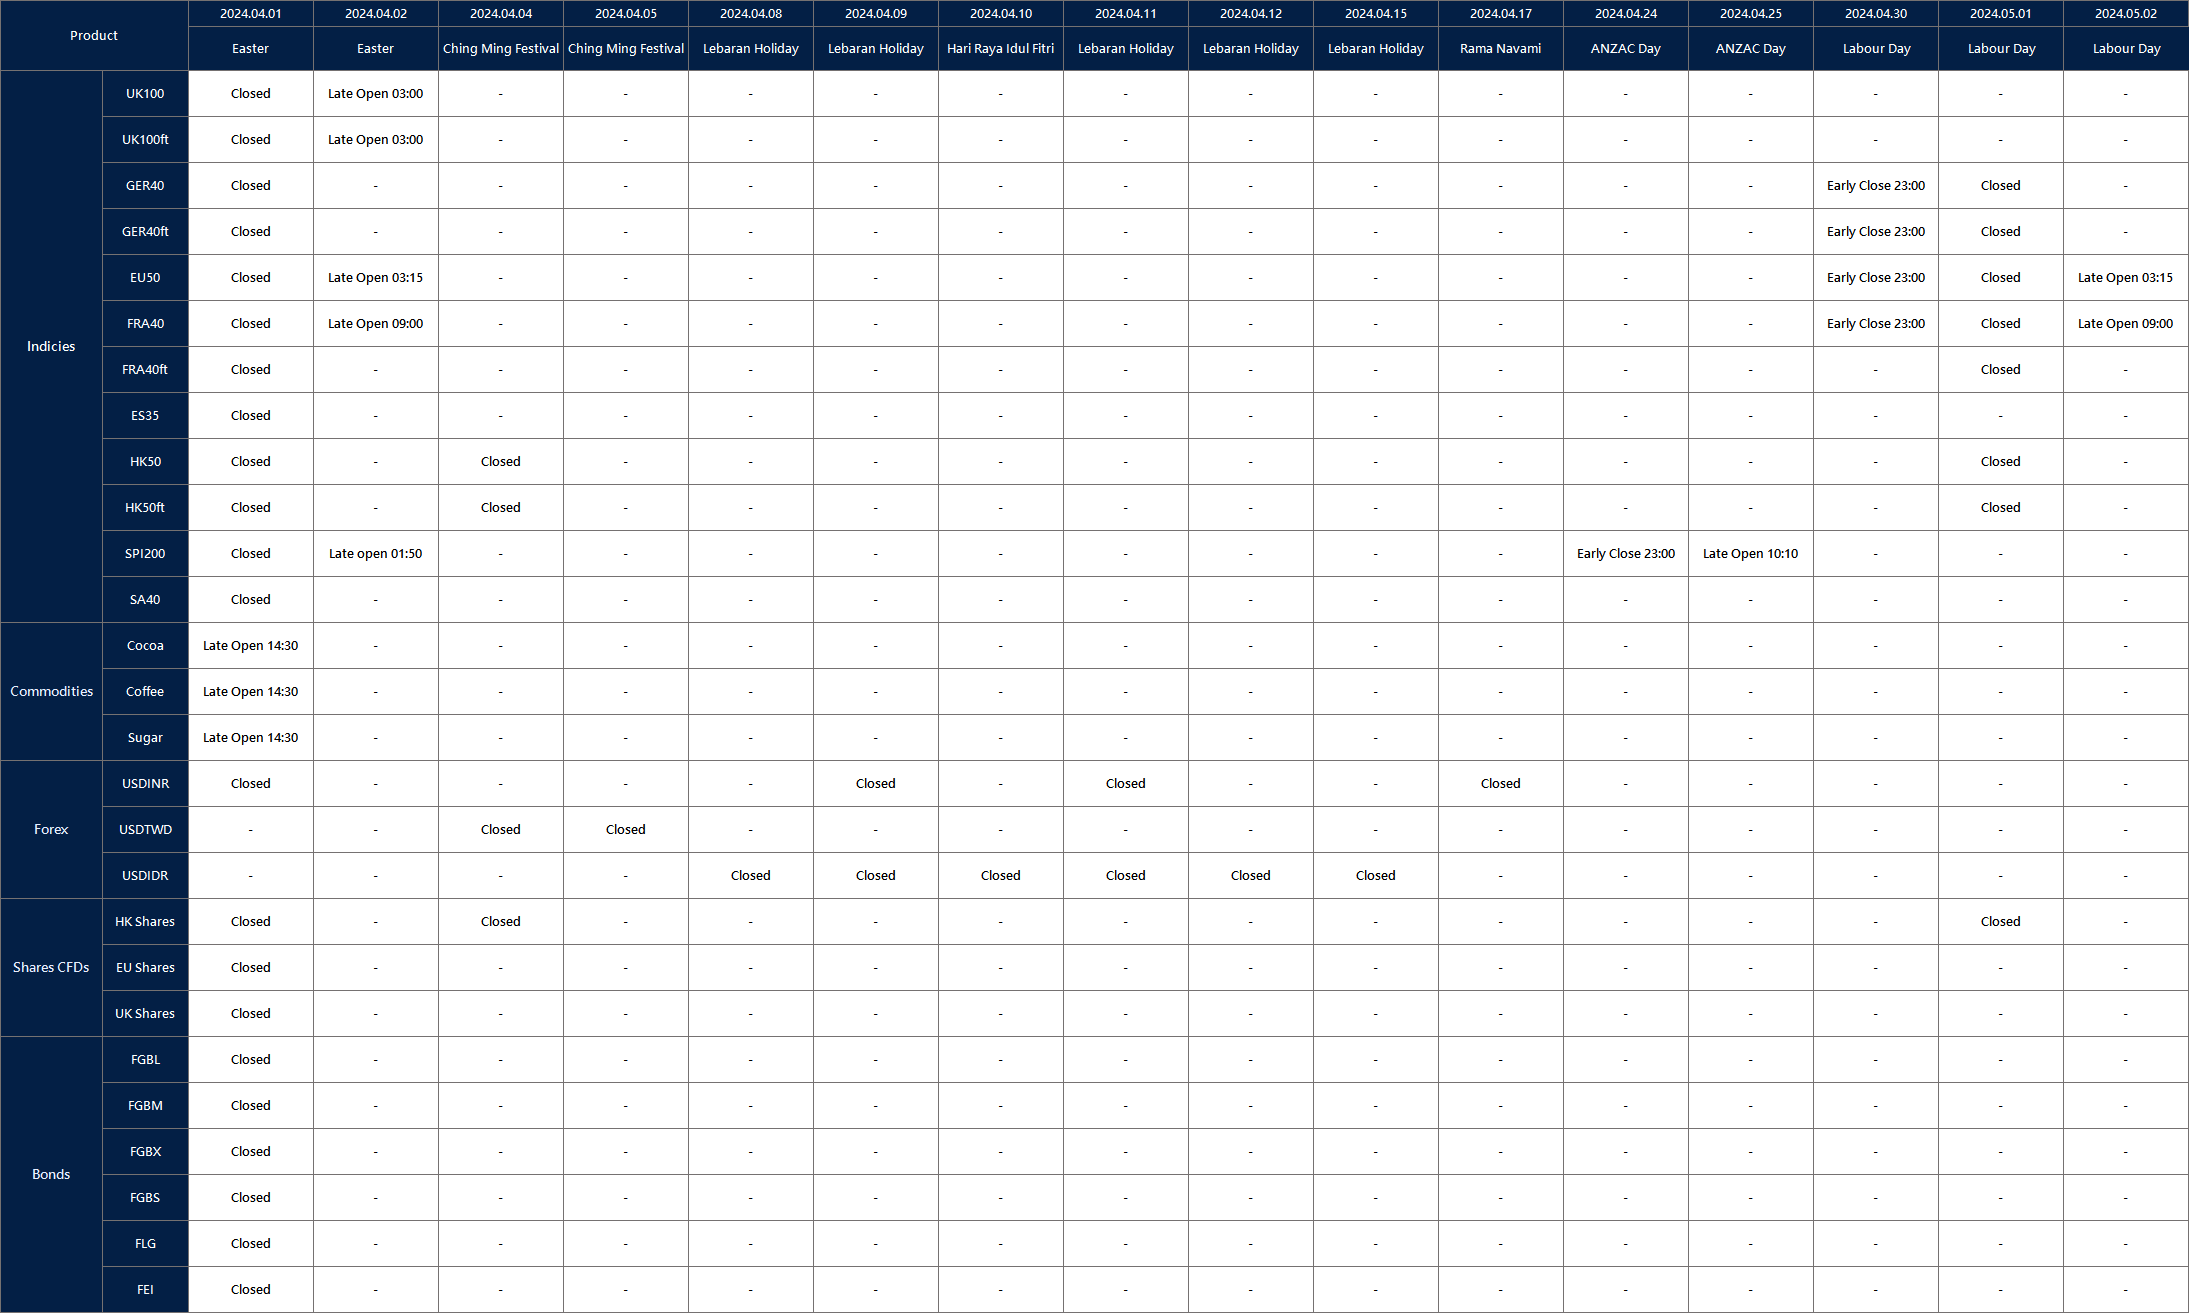
Affected by international holidays, the trading hours of some VT Markets products will be adjusted. Please check the following link for the remaining affected products:
Navigating the world of trading can feel like entering a maze without a map. But fear not, with the right strategies in your toolkit, you can confidently manoeuvre through the markets and seize opportunities for profit.
In this guide, we’ll break down the top 10 trading strategies that are currently making waves in the forex markets in 2024, to help you level up your trading game.
1. Riding the trend: Trend following strategies
Picture yourself catching a wave at the beach – you want to ride it as far as it takes you, right? That’s the idea behind trend following. Simply put, it means hopping on board with the market’s momentum. Think of it like joining a parade that is already in full swing. By using tools like moving averages and moving average convergence/divergence indicator (MACD), you can spot the direction the market is heading and hop on for the ride.
2. Staying in the zone: Range trading strategies
Ever noticed how some stocks seem to bounce between certain price levels like they are stuck on a trampoline? That’s what we call a “range.” Range trading involves buying low and selling high within these predictable boundaries. It’s like playing ping pong – you wait for the ball to bounce off one side before smacking it back the other way. With indicators like Bollinger Bands and relative strength index (RSI), you can pinpoint these sweet spots and make your moves accordingly.
3. Breaking out: Breakout trading strategies
Breakout trading involves capitalising on significant price movements that occur when the price breaks out of a predefined range or consolidation phase. Consider a scenario where a stock has been trading in a tight range for an extended period. As the price breaks above the resistance level with high volume, breakout traders may enter long positions to capitalise on the upward momentum. Effective entry and exit strategies, combined with proper risk management, are essential for successful breakout trading.
4. Snatching quick wins: Scalping strategies
Sometimes, you don’t need to swing for the fences – a bunch of base hits can add up just fine. That’s the philosophy behind scalping. It’s all about making lightning-fast trades to capture tiny price movements. It’s like playing a game of whack-a-mole – you see a chance, you take a swing, and you move on to the next opportunity. With the right tools and a speedy execution, you can rack up profits in no time.
5. Catching the swing: Swing trading strategies
Swing trading is like the Goldilocks of trading – not too fast, not too slow, just right. Instead of aiming for quick wins or long-term investments, you’re looking to capture the “swings” in the market. It’s like catching waves at the beach – you wait for the right one to come along, hop on, and ride it until it fizzles out. With tools like Fibonacci retracements and stochastic oscillators, you can identify these potential waves and hop on for the ride.
6. Reading the market: Price action strategies
Have you ever watched a movie without sound and still understood what was happening? That’s the essence of price action trading – it’s all about reading the story that price movements tell, without relying on indicators or fancy tools. Price action traders focus on candlestick patterns, support and resistance levels, and price structure to make trading decisions. It’s like deciphering a secret code – once you understand the language of price action, you can anticipate market movements with uncanny accuracy.
7. Playing the rebound: Mean reversion strategies
What goes up must come down – and vice versa. That’s the idea behind mean reversion. When a stock strays too far from its average price, it tends to snap back like a rubber band. It’s like playing tug-of-war – when one side pulls too hard, the rope snaps back the other way. By using indicators like Bollinger Bands and RSI, you can spot these overbought or oversold conditions and make your move before the price rebounds.
8. Riding the momentum: Momentum trading strategies
When the wind is at your back, why fight it? That’s the philosophy behind momentum trading. It’s all about hopping on board with the market’s strongest movers and letting them carry you to profits. It’s like catching a gust of wind with a sailboat – you hoist your sails, and off you go. With indicators like MACD and RSI, you can identify these momentum shifts and ride the wave to potential gains.
9. News flash: News trading strategies
Ever heard the saying, “buy the rumour, sell the news”? That’s the essence of news trading. When big news hits the market, it can cause prices to swing wildly. It’s like trying to predict the weather – you see the storm clouds gathering, and you prepare accordingly. By staying informed and reacting swiftly to market-moving events, you can position yourself to capitalise on these sudden shifts in sentiment.
10. Letting robots do the work: Algorithmic trading strategies
Who says you have to do all the heavy lifting yourself? With algorithmic trading, you can put your trading on autopilot and let the robots do the work for you. It’s like having a personal assistant who never sleeps – they’re always on the lookout for opportunities and ready to pounce. By designing algorithms based on proven strategies like trend following and statistical analysis, you can take emotion out of the equation and trade with precision and discipline.
In conclusion, mastering forex trading doesn’t have to be rocket science. By incorporating these 10 essential strategies into your trading arsenal, you can navigate the markets with confidence and seize opportunities for profit. Remember, success in trading isn’t about luck – it’s about having the right tools, the right mindset, and the right strategies. So go ahead, take the plunge, and start putting these strategies to work for you. Your journey to becoming a successful trader starts now!
Please note that the dividends of the following products will be adjusted accordingly. Index dividends will be executed separately through a balance statement directly to your trading account, and the comment will be in the following format “Div & Product Name & Net Volume ”.
Please refer to the table below for more details:
The above data is for reference only, please refer to the MT4/MT5 software for specific data.
If you’d like more information, please don’t hesitate to contact info@vtmarkets.com.


