The glamour of trend trading

Capturing the hottest moments in the market

Imagine the market as a bustling red carpet event, where every asset is a celebrity and every trader a paparazzi. Cameras flash, and eyes dart, seeking the hottest stars – the trends. In this fast-paced world, trend trading emerges as a strategy that not only keeps up with the glamour but also reaps the rewards of being in the right place at the right time. 

Trend trading, akin to snapping a perfect photo of a celebrity at their peak, involves identifying and riding market trends.

The allure is undeniable: A trend trader follows the momentum of the market, capturing gains as the asset price moves in a consistent direction. 

What is trend trading? 

Trend trading is a strategy that involves analysing the price momentum of an asset in one direction – either up or down – and making trades based on the perceived continuation of this trend.

This approach capitalises on the idea that “the trend is your friend,” allowing traders to ride the waves of market movements. 

Traders use various tools and indicators to identify trends, such as moving averages, trendlines, and momentum indicators like the Relative Strength Index (RSI).

These tools help in pinpointing the start and end of a trend, ensuring traders can enter and exit positions at optimal points. 

The tools of the trade 

Just like how a paparazzi needs a good camera, a trend trader requires specific tools to spot and follow trends. Here are some key instruments in the arsenal of a trend trader: 

Moving averages 

Moving averages smooth out price data to help identify the direction of a trend. The two most commonly used types are the Simple Moving Average (SMA) and the Exponential Moving Average (EMA).

Traders often use the 50-day and 200-day moving averages to gauge the overall trend. 

Trend lines 

Drawing trend lines on a chart helps traders visually identify the direction of the trend. An upward trend line is drawn by connecting the successive higher lows, while a downward trend line connects the lower highs. 

Yes. YES. Nuff’ said

Technical indicators 

Indicators like the Relative Strength Index (RSI), Moving Average Convergence Divergence (MACD), and Bollinger Bands provide additional insights into the strength and potential continuation of a trend.

These tools can signal overbought or oversold conditions, helping traders make informed decisions. 

Strategies to be successful in trend trading 

Trend trading can be implemented through various trading strategies, each with its unique approach to capturing market movements. Here are some popular ones: 

Following the trend 

This straightforward strategy involves identifying the direction of the trend and entering trades in the same direction.

For instance, if the market is in an uptrend, traders look for buying opportunities. Conversely, in a downtrend, they seek selling opportunities. 

Trade the breakout 

Breakout traders look for key levels of support and resistance. When the price breaks through these levels, it often signals the beginning of a new trend.

Traders enter positions as soon as the breakout occurs, aiming to capture the momentum of the new trend. 

Make your entry during the pullback 

In a trending market, prices often retrace or pull back before continuing in the original direction. Pullback traders wait for these retracements and enter positions at more favourable prices.

This strategy aims to capitalise on temporary price corrections within a trend. 

Examples of trend trading 

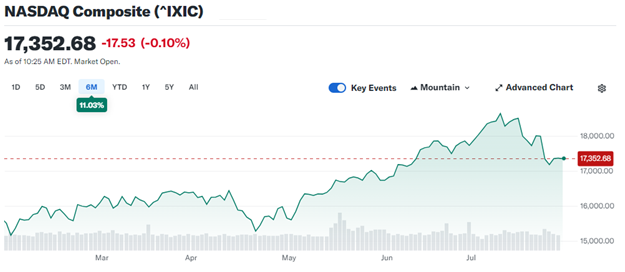
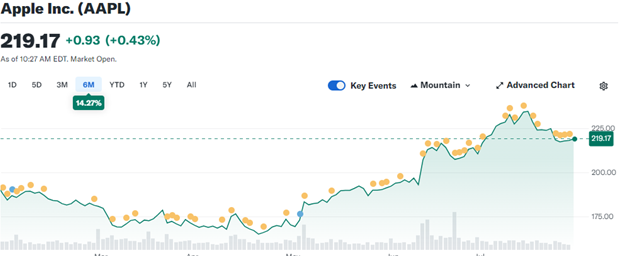
Apple (Symbol: AAPL) 

The stock price of Apple has exhibited strong trends over the years. During its meteoric rise from 2009 to 2020, trend traders who entered into buy positions of AAPL when they identified an upward trend and held onto them profited significantly.

By following the trend and avoiding the urge to sell during minor pullbacks, these traders maximised their returns. 

Euro vs US dollar (Symbol: EURUSD) 

The EURUSD currency pair is one of the most traded in the forex market. Its price movements often exhibit clear trends.

For example, during the period of 2017 to 2018, EURUSD experienced a strong uptrend. Trend traders who recognised this upward momentum and entered buy positions profited as the euro strengthened against the dollar. 

The pros and cons of trend trading 

Here are the reasons why you should use trend as your friend, and what you should be looking out for when you decide to deploy trend trading as your strategy. 

Pros 

  • Simplicity: Trend trading is straightforward and easy to understand. 
  • Profit potential: It allows traders to capitalise on significant market movements. 
  • Flexibility: Can be applied to various markets, including stocks, forex and commodities. 

Cons 

  • Market Dependency: Relies heavily on the market trending in a clear direction. 
  • Timing: Requires precise timing for entry and exit to maximise profits and minimise losses. 
  • Volatility: Sudden market reversals can lead to significant losses. 

Use trends as your friend as you navigate the financial markets 

Trend trading, much like the pursuit of a paparazzi for the perfect shot, requires a keen eye, patience, and the ability to act swiftly. By understanding market trends and employing effective strategies, traders can capture the biggest market movements and turn them into profitable opportunities.

As with any trading strategy, continuous learning and adaptation are key to long-term success. Explore 1000+ assets being offered by VT Markets and tart your financial trading journey today! 

Open a live account 

Dividend Adjustment Notice – Aug 6,2024

Dear Client,

Please note that the dividends of the following products will be adjusted accordingly. Index dividends will be executed separately through a balance statement directly to your trading account, and the comment will be in the following format “Div & Product Name & Net Volume ”.

Please refer to the table below for more details:

The above data is for reference only, please refer to the MT4/MT5 software for specific data.

If you’d like more information, please don’t hesitate to contact info@vtmarkets.com.

Dividend Adjustment Notice – Aug 5,2024

Dear Client,

Please note that the dividends of the following products will be adjusted accordingly. Index dividends will be executed separately through a balance statement directly to your trading account, and the comment will be in the following format “Div & Product Name & Net Volume ”.

Please refer to the table below for more details:

The above data is for reference only, please refer to the MT4/MT5 software for specific data.

If you’d like more information, please don’t hesitate to contact info@vtmarkets.com.

Notification of Trading Adjustment in Holiday – Aug 5, 2024  

Dear Client,

Affected by international holidays, the trading hours of some VT Markets products will be adjusted. Please check the following link for the affected products:

Notification of Trading Adjustment in Holiday

Note: The dash sign (-) indicates normal trading hours.

Friendly Reminder:
The above data is for reference only, please refer to the MT4/MT5 software for specific data.

If you’d like more information, please don’t hesitate to contact info@vtmarkets.com.

Dividend Adjustment Notice – Aug 2,2024

Dear Client,

Please note that the dividends of the following products will be adjusted accordingly. Index dividends will be executed separately through a balance statement directly to your trading account, and the comment will be in the following format “Div & Product Name & Net Volume ”.

Please refer to the table below for more details:

The above data is for reference only, please refer to the MT4/MT5 software for specific data.

If you’d like more information, please don’t hesitate to contact info@vtmarkets.com.

Notification of Server Upgrade – Aug 1, 2024

Dear Client,

As part of our commitment to provide the most reliable service to our clients, there will be MT4 server maintenance this weekend.

MT4 Maintenance Hours:
03th of August 2024 (Saturday) 09:00 – 13:00 (GMT+3)

Please note that the following aspects might be affected during the maintenance:
1. The price quote and trading management will be temporarily disabled during the maintenance. You will not be able to open new positions, close open positions, or make any adjustments to the trades.
2. There might be a gap between the original price and the price after maintenance. The gaps between Pending Orders, Stop Loss and Take Profit will be filled at the market price once the maintenance is completed. It is suggested that you manage the account properly.

Please refer to the MT4 software for the specific maintenance completion and marketing opening time.

Thank you for your patience and understanding about this important initiative.

If you’d like more information, please don’t hesitate to contact info@vtmarkets.com

Dividend Adjustment Notice – Aug 1,2024

Dear Client,

Please note that the dividends of the following products will be adjusted accordingly. Index dividends will be executed separately through a balance statement directly to your trading account, and the comment will be in the following format “Div & Product Name & Net Volume ”.

Please refer to the table below for more details:

The above data is for reference only, please refer to the MT4/MT5 software for specific data.

If you’d like more information, please don’t hesitate to contact info@vtmarkets.com.

AI Stocks Lead Q3 with Value Plays Rising for 2024

Key points:

  • The US equity market increased by 3.20% in Q3 and 13.77% year-to-date, largely driven by AI-related stocks.
  • The price-to-fair value ratio of the US stock market rose to 1.03, indicating potential overvaluation.
  • Growth stocks are trading at a premium, while value stocks are at a discount, suggesting a strategic shift may be beneficial.

The third quarter of 2024 has seen intriguing developments in the US equities market, with attention on the performance of AI-related stocks.

As we approach the end of the quarter, investors are questioning whether the AI stock trade has reached its peak.

Q3 US Equity Market Boosted by AI-Driven Growth

As of June 24, the Morningstar US Market Index, representing the broad US equity market, increased by 3.20% for the quarter and 13.77% year-to-date.

This rise has been largely fueled by the performance of stocks related to artificial intelligence.

AI Stocks Leading the Charge

The second quarter’s gains were concentrated in a handful of AI-related stocks, including Nvidia (NVDA), Apple (AAPL), Microsoft (MSFT), Alphabet (GOOGL), and Broadcom (AVGO).

An attribution analysis reveals that without these gains, the broad market index would have declined. This trend raises questions about the sustainability of the AI-driven rally.

Market Valuation Concerns

The US stock market’s price-to-fair value ratio rose to 1.03, reflecting a 3% premium over fair value estimates as of June 24.

While this doesn’t yet signal an overvalued market, it places it near the higher end of the fair value range seen since 2010.

Historically, the market has only traded at this premium or higher 10% of the time.

The AI Surge and Its Implications

AI-related stocks continued to surge, heavily influencing the Morningstar US Growth Index and, to a lesser extent, the Morningstar US Core Index. Both indexes outperformed the Morningstar US Value Index.

However, based on current valuations, the outperformance of these AI stocks appears to be waning.

Growth vs. Value Stocks

Growth stocks traded at a 6% premium to Morningstar’s composite valuations, and core stocks at a 7% premium as of June 24. In contrast, value stocks remain attractively priced at a 9% discount.

This disparity suggests that long-term investors may benefit from shifting focus from overextended growth and core stocks to undervalued value stocks.

Sector Analysis and Investment Strategy

Given the current market dynamics, we recommend adjusting your investment strategy.

Growth and core stocks have become overextended due to the AI-driven surge, making it prudent to underweight these stocks. In contrast, value stocks present a better margin of safety and potential for future gains, warranting an overweight position.

Additionally, focusing on small-cap and mid-cap stocks is advisable, as these categories offer attractive valuations compared to the increasingly overvalued large-cap stocks.

Specific Sector Opportunities

While the broad market shows signs of overvaluation, there are specific sectors with promising opportunities:

  • Real Estate: Despite negative sentiment, real estate, particularly REITs with defensive characteristics, offers attractive investments.
  • Energy: The energy sector, trading at a discount, provides a natural hedge against geopolitical risks and persistent inflation.
  • Basic Materials: Select gold miners and agricultural chemical producers offer value, even in a slowing economy.

Shifting Focus to Value Stocks and Small Caps for Better Returns in 2024

The concentrated rally in AI stocks during the third quarter of 2024 has sparked worries about market overvaluation.

As we look forward, shifting focus from overvalued growth and core stocks to undervalued value stocks and smaller-cap opportunities may provide better investment returns. Stay informed and strategic to navigate this evolving market landscape effectively.

Dividend Adjustment Notice – July 31,2024

Dear Client,

Please note that the dividends of the following products will be adjusted accordingly. Index dividends will be executed separately through a balance statement directly to your trading account, and the comment will be in the following format “Div & Product Name & Net Volume ”.

Please refer to the table below for more details:

The above data is for reference only, please refer to the MT4/MT5 software for specific data.

If you’d like more information, please don’t hesitate to contact info@vtmarkets.com.

Athletes are eyeing gold at the Paris 2024 Olympics. So should you.

Here’s the twist: Not all that glitters are gold. You’re about to find out what exactly goes into the 2024 Olympic gold medal and why it’s worth examining the value of these precious metals.

Close-up image of the gold, silver, and bronze medals for the Paris 2024 Olympics placed on the official Paris 2024 logo background. Showcasing the Olympic spirit and the prestigious awards for athletic excellence, this image highlights the intricate design of the medals and the iconic Olympic rings.
2401874133

After a century, the 2024 Summer Olympics will see the games return to Paris.

All in for the win, the world’s top athletes dedicated years to their sport. Olympic champion Jess Fox is hoping to make it back-to-back gold this year and will be competing tirelessly to take home the ultimate symbol of glory—the Olympic gold medal.

On Thursday 8 February, Tony Estanguet, President of the Paris 2024 Organising Committee unveiled the medals of the upcoming Paris Olympic and Paralympics.

The Paris Mint is manufacturing 5,084 medals. Of this number about 2,600 are for the Olympics and 2,400 for the Paralympics.

Each gold, silver, and bronze medal features an 18-gram hexagonal chunk of iron that was once part of the Eiffel Tower. The medals measure 85mm in diameter and 9.2mm in thickness.

Unlike any medals awarded since Athens 1896, LVMH’s Chaumet has taken up the challenge of combining these precious metals. They have brought the vision of modern Olympic medals to life, incorporating a small piece of Paris into each design.

Breaking down the composition of the gold medal

Silver gets the gold

You’d be forgiven thinking that the Olympics Paris 2024 gold medal is made of gold.
The fact is that it isn’t made of gold at all. Only 6 grams are pure gold, used for plating.

95% of the Olympic gold medal is actually silver—505 grams, to be exact.
The remaining 18 grams are iron.

The silver medal weighs 525 grams, with 507 grams of silver and 18 grams of iron. Based on the spot prices for silver and iron as of July 24, its value is around $486.

Based on VT Markets’ analysis, silver has been recognised as the top-performing commodity of 2024. Silver prices (Symbol: XAGUSD) have risen by 21% year-to-date in 2024, outperforming other metals like gold and copper, as well as the S&P 500 index.

Read the full analysis here: Silver shines bright as the best-performing commodity of 2024

The bronze medal weighs 455 grams, made up of 415.15 grams of copper, 21.85 grams of zinc, and 18 grams of iron. Its value is roughly $13.

Key stats behind the Paris 2024 medals

529g: the weight of the gold medal
Gold plating: 6 grams
Silver: 505 grams
Eiffel Tower iron: 18 grams

525g: the weight of the silver medal
Silver: 507 grams
Eiffel Tower iron: 18 grams

455g: the weight of the bronze medal
Copper: 415.15 grams
Zinc: 21.85 grams
Eiffel Tower iron: 18 grams

How much is the metal of an Olympic medal worth?

If these medals were made entirely of gold, they’d be worth around $41,161.50 each! That’s why the last time they handed out pure gold medals was way back in 1912.
 
While the monetary value of an Olympic medal is around $500, that doesn’t mean athletes don’t make money at all.

The payout for Olympic medalists varies by country— with Malaysia, Morocco, or Serbia receiving an upward of $200,000 from their country’s government or national Olympic committee for bringing home gold. The true value lies in its priceless pride of victory.

Source: USA TODAY

Medals with some history behind them have been sold for an excess of 1 million dollars on auction. The value of past gold medals has surged dramatically due to record gold prices. For example, one of Jesse Owens’ medals from 1936 sold for approximately $1,470,000.

US swimmer Michael Phelps is the most decorated Olympian with 23 golds, 3 silvers, and 2 bronze, earning him the title of “King of medals” in the Summer Olympics and an estimated net worth of $100 million. 

This significant wealth comes from his exceptional swimming career, smart business investments, and profitable brand endorsements.

Hence, the 2024 Olympic medals not only symbolise athletic achievement but also reflect economic dynamics as metal prices continue to fluctuate.

On the topic of gold, you might be interested to discover 4 reasons why traders flock to safe-haven gold during global political tensions 

Our precious metals are made to compete

This makes it an exciting time to examine the raw values of the commodities that make up the Olympic medals.

Although various financial instruments like options, futures, and ETFs are available for trading gold and other precious metals, their performance can differ significantly, especially depending on the broker offering them.

Much like a top Olympian, VT Markets’ CFD precious metals—gold (XAUUSD), silver (XAGUSD), and copper (CME)—demonstrate a competitive edge in a highly dynamic market. Trading with VT Markets offers advantages like ultra-low spreads and flexible leverage options up to 500:1.

With a diverse precious metals portfolio for you to choose from, it’s easy to optimise your trading strategy and align them with your preference. In the same way athletes compete in multiple events to increase their chances of winning, trading various precious metals like gold, silver, and platinum helps diversify your portfolio, spreading out risk.

Unleash your athletic spirit

In celebration of the 2024 Paris Olympics, VT Markets is running a once-in-four-years campaign where you could win up to USD 14,000 from our prize pool by trading with us. Complete simple daily missions to earn rewards and stay in the race to maximise your gains.

Download the app now to get started

Back To Top
server

Witaj 👋

Jak mogę ci pomóc?

Porozmawiaj natychmiast z naszym zespołem

Czat na żywo

Rozpocznij rozmowę na żywo przez...

  • Telegram
    hold Wstrzymane
  • Już wkrótce...

Witaj 👋

Jak mogę ci pomóc?

telegram

Zeskanuj kod QR telefonem, aby rozpocząć czat z nami, lub kliknij tutaj.

Nie masz zainstalowanej aplikacji Telegram ani wersji Desktop? Skorzystaj z Telegram Web .

QR code