Maserati MSG Racing and VT Markets announce new partnership in Formula E
Two Giants Unite
As Season 10 of the FIA Formula E World Championship fast-approaches, Maserati MSG Racing is proud to announce a multi-year global partnership with VT Markets, a leading online broker in the financial space.
Marking one of the first collaborations of its kind in the Forex landscape — and VT Markets’ first sporting partnership — the move sees two industry giants unite as both the motorsport and financial sectors join forces.
The Power of Opportunity
In an industry saturated by competition, VT Markets has broken from the pack and is accelerating into the future with its customers in mind by making trading more accessible for all.
Like Maserati MSG Racing, VT Markets believes in the power of opportunity and advancement. By leveraging and coupling constant innovation with best-in-class service standards, the brokerage continues to break new ground by successfully simplifying a once complex trading process.
Since its launch in 2015, VT Markets has facilitated new opportunities by allowing everyday traders to enjoy a smooth, stress-free experience, both online and on its award-winning mobile app.
The Race for a Better Tomorrow
Maserati MSG Racing is delighted to welcome VT Markets to the world of Formula E. Following a successful Season 9 — which yielded four podiums and the Maserati brand’s first victory in World Championship single-seaters since 1957 — the team has its sights firmly set on further glory in Season 10.
United by a shared belief in uncompromising performance and technical innovation, Maserati MSG Racing and VT Markets will forge their bond in Formula E to create and safeguard an environmentally and socially sustainable future.
Alongside racing together with a common purpose, VT Markets’ branding will feature on the cars and race suits of drivers Maximilian Günther and Jehan Daruvala, in the team’s garage, and across teamwear in Season 10.
Pre-season testing for Formula E’s 2023/24 campaign will take place at Valencia’s Circuit Ricardo Tormo from 23–27 October ahead of the series’ season-opening race in Mexico City on 13 January, 2024.
In Their Words
Scott Swid, Chairman & Managing Partner, Maserati MSG Racing
“We are very pleased to welcome VT Markets to the Maserati MSG Racing family. Our partners are an integral part of our family and they play a critical role in our journey. Coming from the fast-paced world of finance, VT Markets fully understands our relentless pursuit of performance excellence in Formula E, and our shared passion for technical innovation will make for a dynamic, exciting, and hopefully rewarding journey together from Season 10 onwards.”
Harry Richards, Commercial Director, Maserati MSG Racing
“Season 10 is a very exciting time to be a part of Formula E, and we’re delighted to welcome VT Markets to Maserati MSG Racing. Since its inception in 2014, Formula E has carved out a unique position in the motorsport landscape and has become a go-to destination for premium global brands to showcase their vision. Innovation is at the heart of what we do as a racing team, and so to attract like-minded partners, who share and believe in our mission, is in an integral part of our journey. We’re all very excited to work with VT Markets this coming season, and we can’t wait to see what we can achieve together.”
Chief Executive Officer, VT Markets
“This partnership between VT Markets and Maserati MSG Racing represents a unique convergence of two leading brands in their respective fields. While the industries might differ, both organisations are remarkably aligned in their commercial ambitions and vision for the world. The Maserati Trident has long been a distinctive symbol of quality and prestige, and we’re delighted to move into the future alongside partners of such repute.”
About VT Markets:
VT Markets is a regulated multi-asset broker with a presence in over 160 countries. To date, it has won numerous international accolades including Best Customer Service and Fastest Growing Broker.
In line with its mission to make trading accessible to all, VT Markets currently offers unfettered access to over 1,000 financial instruments and a secure, seamless trading experience via its award-winning mobile app.
For media enquiries and sponsorship opportunities, please email media@vtmarkets.com.
Maserati MSG Racing Maserati MSG Racing is one of the founding teams of the FIA Formula E World Championship and in December 2013, became the first manufacturer to join motorsport’s premier fully-electric category. As one of only a handful of constant participants since the series’ inaugural 2014/15 season, MSG Racing has moved from strength to strength and tasted vice World Championship success in 2021 before completing its most successful season to date in 2022, finishing the campaign as the vice World Teams’ Champions.
Let by Chairman & Managing Partner, Scott Swid, and Team Principal, James Rossiter, the Monégasque marque is at the forefront of sustainability, EDI, technical innovation, and excellence. For further information, visit our website. For media hub access and rights-free content, please register here.
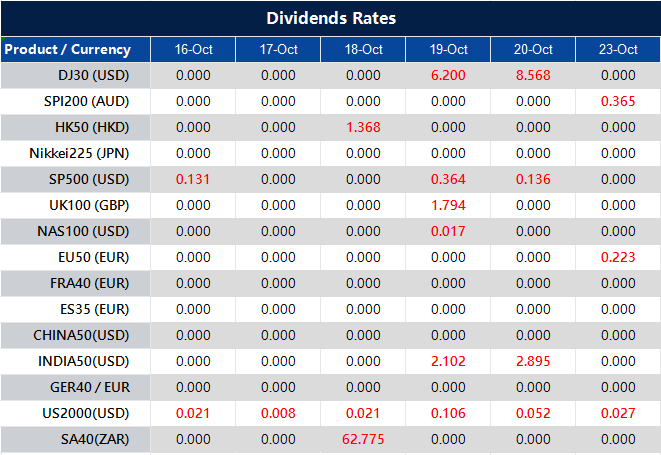
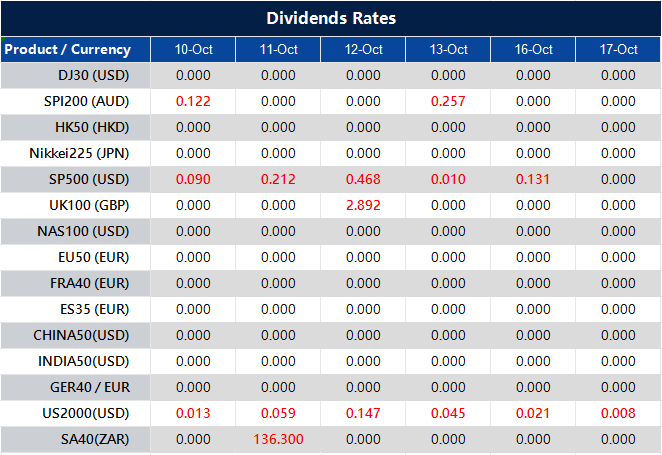
Please note that the dividends of the following products will be adjusted accordingly. Index dividends will be executed separately through a balance statement directly to your trading account, and the comment will be in the following format “Div & Product Name & Net Volume ”.
Please refer to the table below for more details:
The above data is for reference only, please refer to the MT4/MT5 software for specific data.
If you’d like more information, please don’t hesitate to contact info@vtmarkets.com.
Traders should keep a close eye on US retail sales and the Consumer Price Index (CPI) reports from New Zealand, Canada, and the UK this week, as these updates could have a substantial influence on the market. Exercise caution and stay up to date with the latest developments to ensure a successful week of trading.
Here are some notable market highlights for the upcoming week:
New Zealand Consumer Price Index (17 October 2023)
In Q2 2023, the CPI for New Zealand increased by 1.1%.
The CPI data for Q3 is set to be released on 17 October, with analysts anticipating a 1.9% increase.
UK Claimant Count Change (17 October 2023)
The number of people claiming unemployment benefits in the UK increased by 900 in August 2023.
An additional increase of 22,000 is anticipated in the upcoming data, due for release on 17 October.
Canada Consumer Price Index (17 October 2023)
Canada’s CPI rose by 0.4% in August 2023 compared to the previous month.
Analysts expect a 0.1% increase in the September figures, which are scheduled for release on 17 October.
US Retail Sales (17 October 2023)
US retail sales saw a month-over-month increase of 0.6% in August 2023, surpassing the 0.5% uptick recorded in July 2023.
Analysts anticipate a 0.3% increase in the data for September, set to be released on 17 October.
UK Consumer Price Index (18 October 2023)
CPI in the UK eased to 6.7% in August 2023 from 6.8% in the previous month, the lowest rate since February 2022.
CPI figures for the next reporting period are expected to further decrease to 6.5%.
Employment in Australia (19 October 2023)
Employment in Australia increased by 64,900 in August 2023, while the unemployment rate stood at 3.7%.
Analysts anticipate that the employment figures for September 2023 will reflect an increase of 20,900 jobs, with the unemployment rate expected to remain at 3.7%. This data is scheduled for release on 19 October.
UK Retail Sales (20 October 2023)
Retail sales in the UK rose by 0.4% in August 2023, partially recovering from a 1.1% decline in July.
The next set of data will be released on 20 October, with analysts expecting a decrease of 0.3%.
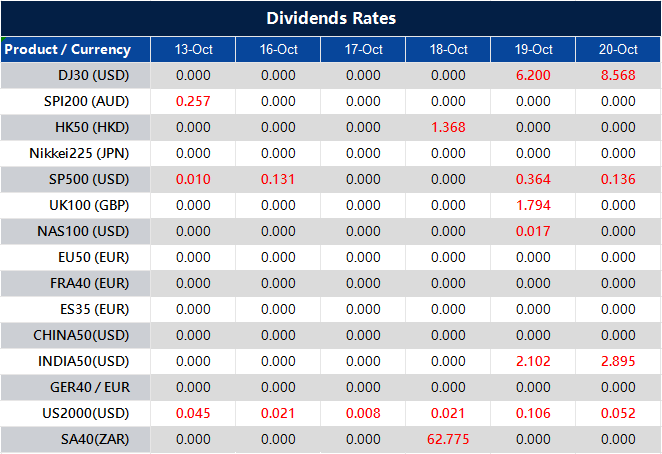
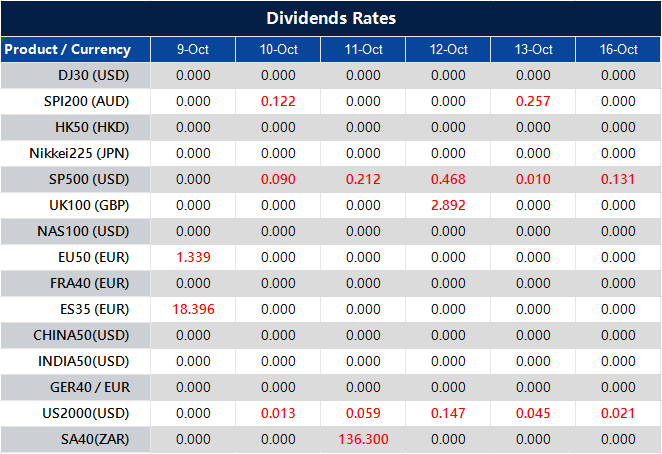
Please note that the dividends of the following products will be adjusted accordingly. Index dividends will be executed separately through a balance statement directly to your trading account, and the comment will be in the following format “Div & Product Name & Net Volume ”.
Please refer to the table below for more details:
The above data is for reference only, please refer to the MT4/MT5 software for specific data.
If you’d like more information, please don’t hesitate to contact info@vtmarkets.com.
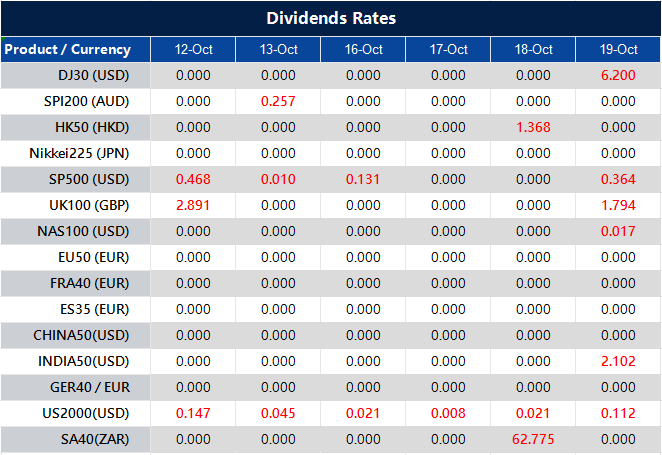
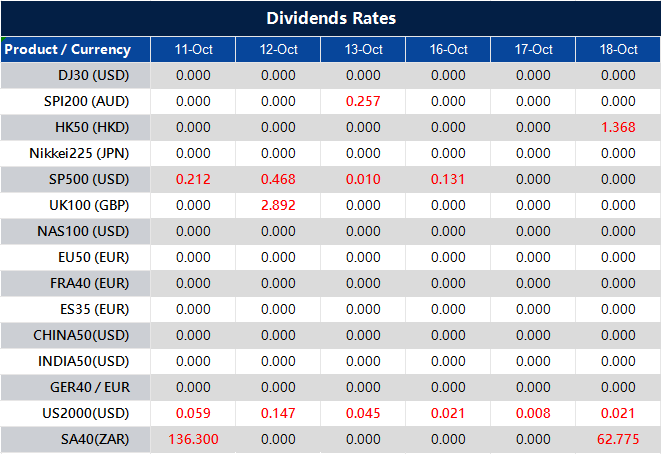
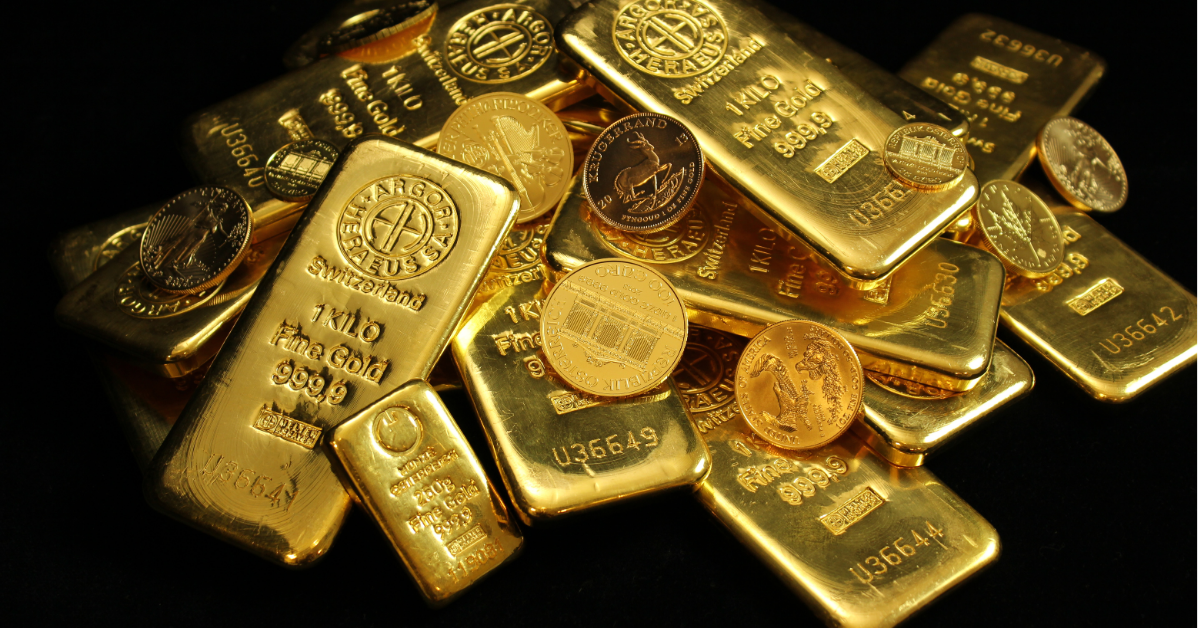
Gold, often referred to as the “King of Metals,” has consistently held a paramount position in the world’s economic landscape, transcending mere aesthetics and luxury.
Gold source ThoughtCo
A prime example underscoring gold’s critical role in the global economy lies in the significant gold reserves central banks maintain. These financial linchpins of nations uphold these reserves as a testament to gold’s unparalleled value, a tradition spanning centuries.
During the height of the late 19th and early 20th-century gold standard era, major economies like the United States anchored their currencies to gold, solidifying the stability of the global financial system.
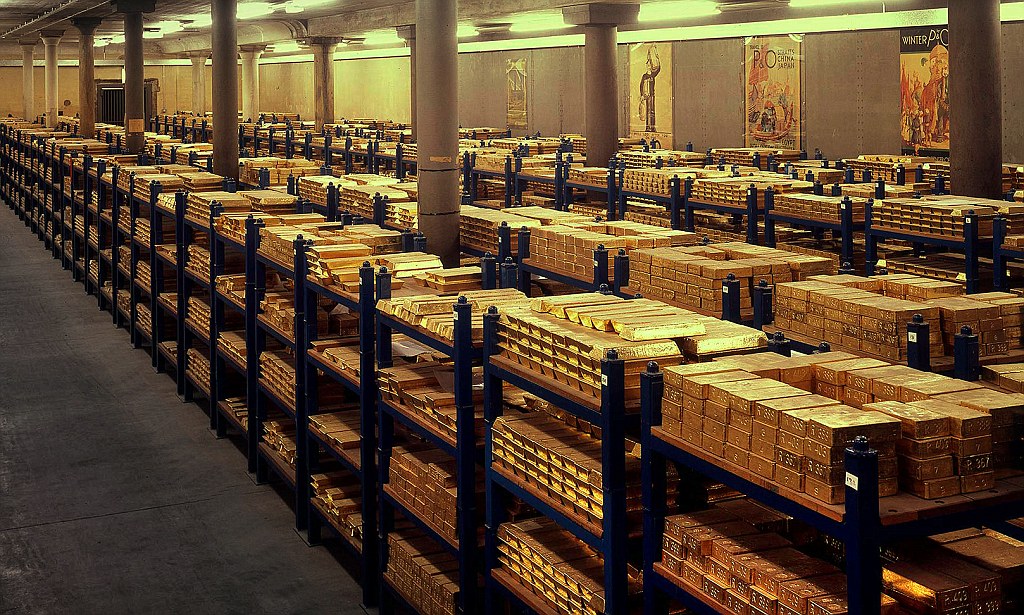
For instance, the U.S., a major economic power at the time, boasted one of the largest gold reserves, officially holding approximately 20,663 metric tons of gold as of 1939, just before the outbreak of World War II. A considerable portion of this gold was securely housed at Fort Knox in Kentucky, a renowned depository.
Gold, beyond its charm, stands as a financial cornerstone, bolstering stability, credibility, and global relations. Appreciating its cultural, economic, and historical worth requires understanding its extensive history. Gold’s journey across civilisations reveals its enduring allure and lasting impact on human history.
Egyptian pharaoh source Business Hub
Ancient Beginnings
Gold, one of the most coveted metals in history, has captivated humanity for millennia. Its appeal can be traced back to ancient civilisations such as the Egyptians, Greeks, and Romans, holding immense cultural, economic, and aesthetic value.
In ancient Egypt, gold was revered as the “flesh of the gods,” symbolising divine power and immortality. Egyptians widely used gold for various purposes, including currency, jewellery, and religious artifacts. Pharaohs were often buried with vast amounts of gold, a testament to its
The Greeks, too, held gold in high esteem, associating it with gods and considering it indestructible due to its non-reactive nature. This perception elevated gold to a divine status, reinforcing its prominence in society.
Gold in Ancient China and India
In ancient China, gold held immense cultural and economic value. It was used for ornamental purposes, religious offerings, and even as a form of currency during various dynasties. The Chinese associated gold with prosperity and believed it brought good luck.
India has a deep-rooted cultural affinity for gold, considering it auspicious and a symbol of purity and prosperity. Gold is an integral part of weddings, festivals, and religious ceremonies, often passed down through generations as heirlooms.
The Spanish Conquest and the New World
During the Spanish conquests in the 15th and 16th centuries, significant gold reserves were uncovered in regions now known as Mexico, Peru, and parts of Central and South America.
Legends like El Dorado drove Spanish explorations, leading to the discovery of abundant gold, especially in present-day Colombia, Venezuela, and the famed silver mines of Potosí in Bolivia.
The influx of gold from the Americas significantly altered global gold supply, affecting trade dynamics and gold’s value worldwide. The wealth from the Americas financed wars, fuelled industries, and facilitated the rise of powerful merchant families, causing a price revolution and laying the foundation for modern banking systems.
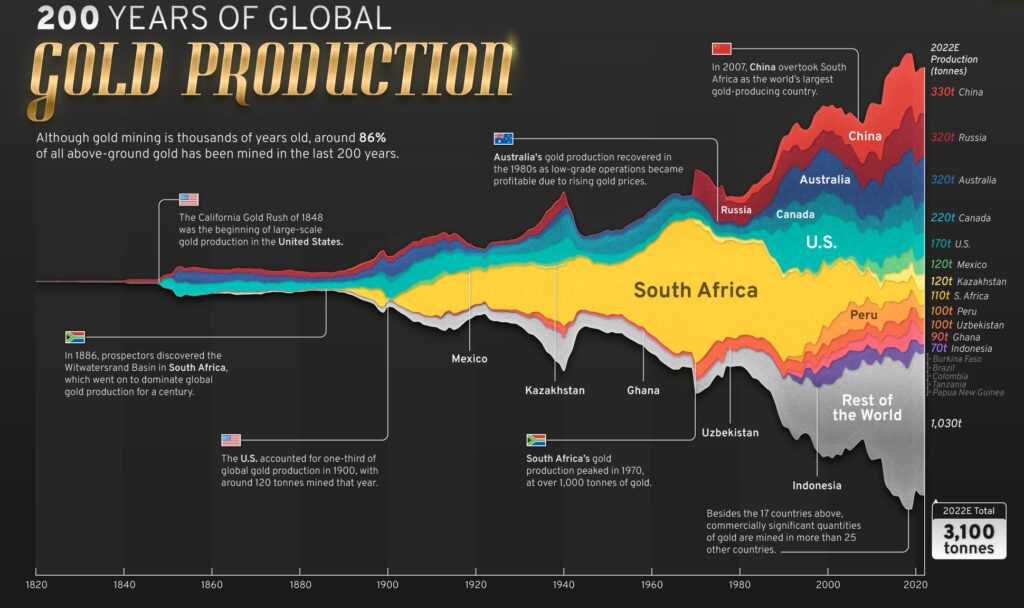
History of Global Gold Production source Visual Capitalist
Gold Rushes and Exploration
The 19th century witnessed the phenomenon of gold rushes, forever altering the course of history. The California Gold Rush (1848-1855) and the Australian Gold Rush (1851) were pivotal events that ignited economic booms, sparking population growth and advancements in mining technologies.
These gold rushes acted as magnets, attracting people from around the globe in search of wealth. The influx of people led to the rapid development of cities, infrastructure, and entire economies in these regions, leaving an enduring mark on their landscapes.
In response to the surging demand for gold, miners and prospectors developed innovative mining technologies and techniques. These advancements not only revolutionised the mining sector but also had a broader impact, driving progress in industrial and engineering domains.
The Gold Standard Era
The late 19th and early 20th centuries witnessed the widespread adoption of the gold standard, anchoring the value of a nation’s currency to a specific quantity of gold. This system instilled confidence in the monetary system and promoted financial stability.
Under the gold standard, each unit of currency was backed by a fixed amount of gold held in reserve, providing a sense of security to holders of that currency. This ensured that the paper currency had tangible value tied to a precious metal.
However, the gold standard’s rigidity became apparent, especially during economic downturns. Governments found it challenging to implement flexible monetary policies to combat economic crises. Consequently, nations began transitioning away from the gold standard, opting for more adaptable monetary systems.
Fort Knox Gold Treasury source Daily Mail
Gold in the Modern Era
The 20th century, marked by the two World Wars, saw a surge in gold demand. Governments and individuals sought gold as a safe-haven asset during times of uncertainty. Post-World War II, gold played a crucial role in shaping the global monetary system, evolving into its significance in the 21st century as a safe-haven asset amid economic volatility and geopolitical tensions.
In recent years, gold has maintained its status as a safe-haven asset, particularly during economic downturns and geopolitical instability. Its value surged after the 2008 financial crisis, highlighting its resilience and enduring relevance in the modern financial landscape.
Gold’s Influence on the Modern Global Economy
Gold, often revered as a timeless symbol of wealth and prosperity, continues to wield immense influence in the contemporary global economy. Explore how this precious metal remains an enduring force, shaping the dynamics of the modern economic landscape.
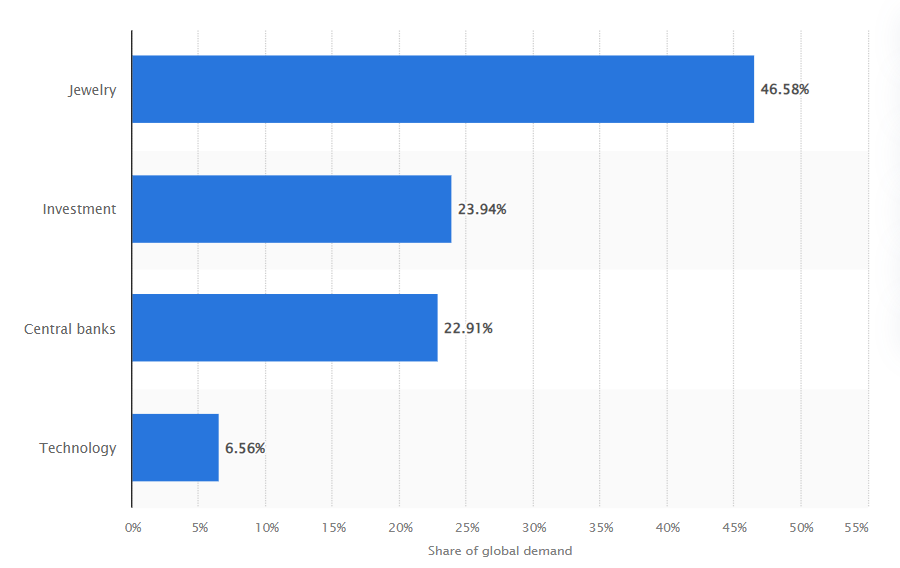
Distribution of gold demand worldwide by sector in 2022 source Statista
The Significance of Gold Reserves for Central Banks
Central banks play a pivotal role in maintaining a stable modern global economy. Gold reserves held by central banks are a fundamental component, providing a solid foundation for economic stability and bolstering a nation’s creditworthiness. These reserves act as a safeguard, particularly during economic downturns and emergencies, instilling confidence in the financial system.
Key players in the global financial landscape, including the United States, Germany, and the International Monetary Fund (IMF), uphold substantial gold reserves. For instance, as of 2023, the United States holds the largest gold reserves globally, amounting to approximately 8,133 metric tons. Germany comes in second with about 3,355 metric tons, followed by the IMF with approximately 2,814 metric tons. These extensive holdings underscore gold’s enduring importance in the modern economic framework, showcasing its resilience and relevance.
Gold’s Role as a Safeguard against Economic Uncertainties
In the contemporary world, gold is universally acknowledged as a reliable hedge against economic uncertainty. Its historical status as a safe-haven asset is reinforced during times of economic turbulence, be it inflation, deflation, geopolitical instabilities, or financial crises. Investors turn to gold, seeking a secure investment that can effectively preserve their wealth in volatile market conditions.
Notably, the demand for gold escalates during economic crises, as it is perceived as a safe bet amidst market volatilities. For example, during the 2008 financial crisis, gold prices surged from around $800 per ounce in 2008 to over $1,900 per ounce in 2011, demonstrating its value as a safe-haven asset during tumultuous times.
Gold’s Multifaceted Role in the Modern Era
Gold’s influence extends far beyond its traditional role. In the contemporary global economy, gold plays a multifaceted and indispensable role. Gold is not only a store of value and a safe-haven asset; it’s widely used in different sectors, making it even more important.
In the realm of jewellery, gold is not just a symbol of opulence but also a representation of tradition and cultural significance. In 2022, the global demand for gold in the jewellery sector amounted to approximately 2,086 metric tons.
Its exceptional conductivity properties make it a vital component in the electronics industry, contributing to the production of various technological devices. Furthermore, its unique attributes make gold indispensable in specialised applications like aerospace technology and medical devices.
Golden Jewellery source Arabian Business
Factors Shaping Gold Prices
Numerous factors intricately affect gold prices in the global market, including supply-demand dynamics, economic indicators, geopolitical events, currency strength, central bank policies, market speculation, and industrial demand. Understanding these influences is crucial for comprehending gold market dynamics.
Supply and Demand: Gold prices respond to changes in gold production, recycling, central bank transactions, and demand from sectors like jewellery and industry.
Economic Factors: Gold can serve as a hedge against inflation, with higher inflation often boosting demand. Interest rates also impact gold prices, with lower rates making gold more attractive.
Geopolitical Events: Geopolitical tensions, conflicts, and trade disputes can drive investors to seek the safety of gold, elevating its prices.
Currency and US Dollar: Gold often moves inversely to the US dollar, becoming more appealing when the dollar weakens. It can also serve as a safe-haven currency.
Central Bank Policies: Monetary decisions and gold transactions by central banks can directly influence gold prices and market sentiment.
Market Sentiment and Speculation: Investor sentiment and speculative trading activities can result in short-term price fluctuations.
Industrial Demand: Gold’s use in electronics and industry impacts its price, with technological trends influencing demand.
In conclusion, comprehending gold’s historical journey unveils not only its economic implications but also its profound impact on our lives and businesses. Gold symbolises human creativity, resilience, and adaptability. It acts as a bridge across generations, a timeless emblem that continues to influence our world, connecting our past, present, and future. As we navigate the complexities of economics and trade, the enduring value of gold in the tapestry of humanity remains a constant and compelling reminder.
Please note that the dividends of the following products will be adjusted accordingly. Index dividends will be executed separately through a balance statement directly to your trading account, and the comment will be in the following format “Div & Product Name & Net Volume ”.
Please refer to the table below for more details:
The above data is for reference only, please refer to the MT4/MT5 software for specific data.
If you’d like more information, please don’t hesitate to contact info@vtmarkets.com.
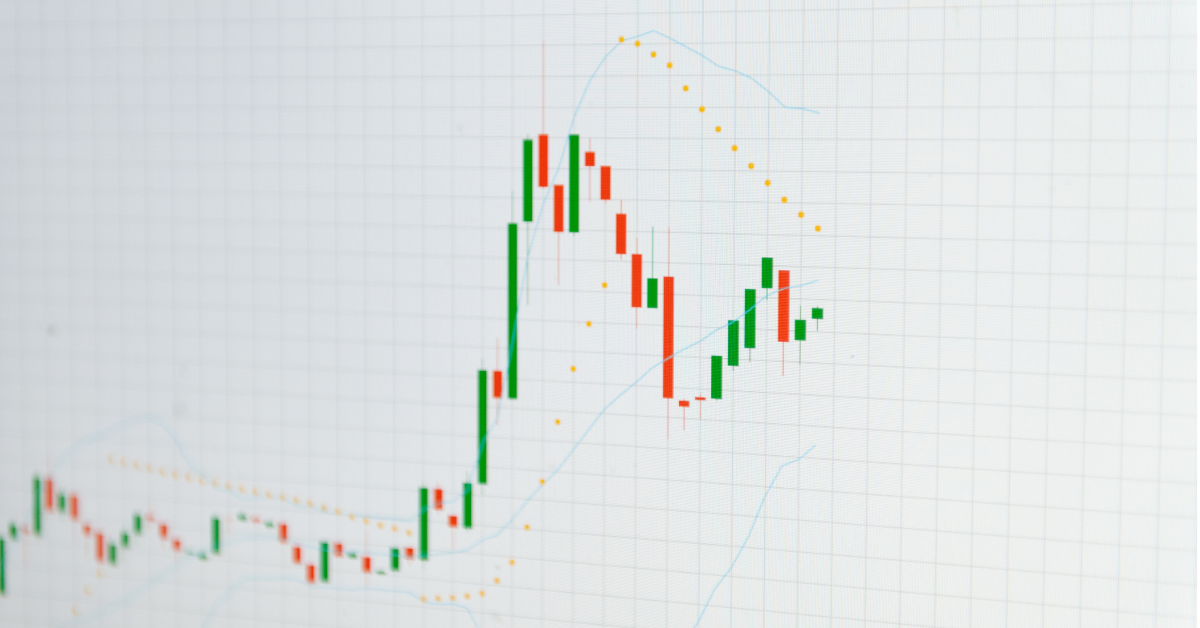
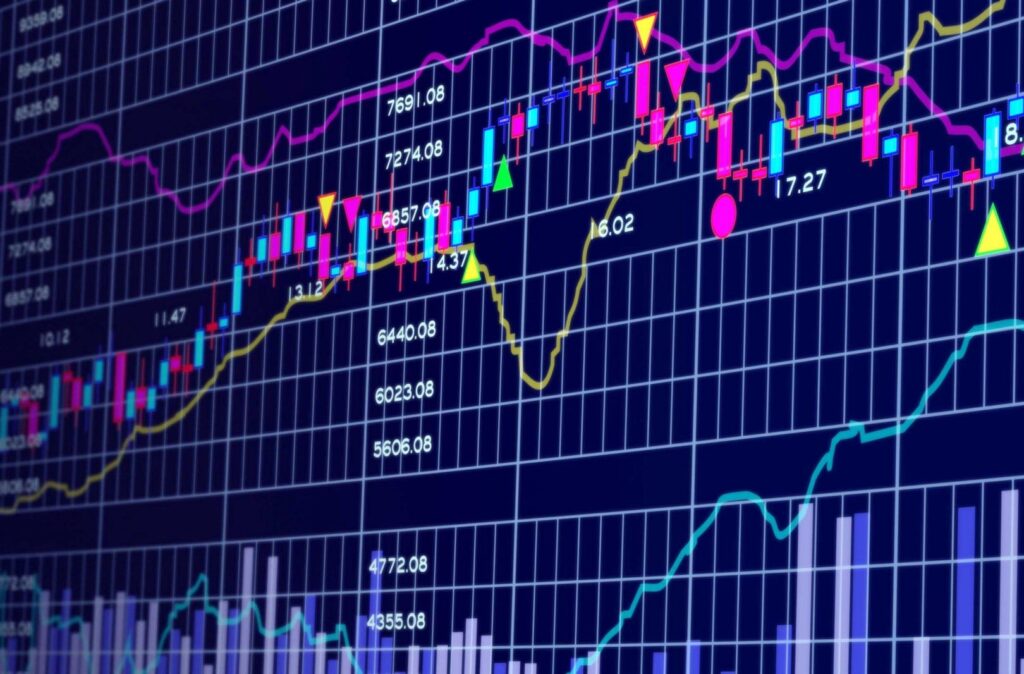
In the not-so-distant past, Forex trading was primarily driven by intuition, market experience, and fundamental analysis. However, the introduction of Forex chart indicators revolutionised the landscape, providing traders with a powerful analytical tool that transformed decision-making.
A trader using chart indicators Source: Shutterstock
Forex chart indicators brought a scientific approach to trading, enabling traders to objectively analyse historical price data and predict potential future price movements. Traders could now identify patterns, trends, and market behaviour, allowing for more accurate entry and exit points. This shift from gut-feeling trading to data-driven analysis was similar to shedding light on a previously dimly lit path.
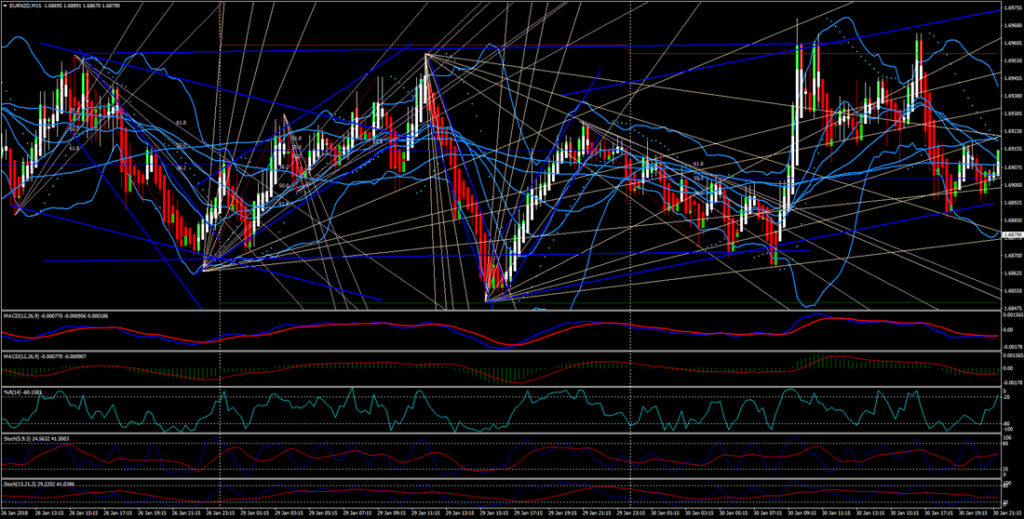
By empowering traders with a plethora of indicators from Moving Averages to Bollinger Bands, RSI, MACD, and more – charting tools equipped them with a deeper understanding of market dynamics. These indicators acted as beacons, illuminating market trends, volatility, and momentum. Traders could fine-tune their strategies, manage risk, and optimise their trades for greater profitability.
Furthermore, the advent of technology, especially online trading platforms democratised access to these indicators. What was once exclusive to institutional traders and professionals became readily available to individual traders. Now, traders, whether seasoned or beginners, could harness the power of chart indicators to level the playing field.
Today, Forex chart indicators are an integral part of every trader’s toolkit. They have shifted trading from speculative guessing to informed decision-making, contributing to the growth and accessibility of the Forex market. This evolution underscores the profound impact of technology and analytics on the financial world, ushering in a new era of possibilities for traders around the globe.
Chart indicators Source: Investgrams
What are Chart Indicators?
Chart indicators are fundamental tools used in financial analysis, specifically in the domain of Forex trading. These tools are grounded in mathematical calculations and are applied to a variety of market data, such as price and volume, to provide insights into market trends and potential future price movements.
The primary objective of chart indicators is to assist traders in understanding the complex dynamics of the market and to aid in the development of effective trading strategies. Through careful interpretation of these indicators, traders can make informed predictions about the likely changes in price, enabling them to execute timely decisions to either maximise gains or minimise losses.
At the core of chart indicators lies mathematical algorithms. These algorithms process historical and real-time market data to generate specific values, often displayed on charts, that traders can analyse. The calculations involved in these indicators may consider various parameters, including price, volume, or a combination of both, depending on the type of indicator being used.
A trader using chart indicators Source: Shutterstock
How Do Chart Indicators Help Traders?
Chart indicators function as a lens that magnifies and simplifies the intricate market dynamics. They help traders identify patterns, trends, and potential turning points, giving a clear view of the market’s behaviour. For example, a moving average smoothes out price data, revealing the underlying trend more clearly.
Understanding market dynamics is pivotal in devising successful trading strategies. Chart indicators equip traders with crucial information, allowing them to strategise their trades. For instance, an RSI reading above 70 might indicate an overbought market, prompting traders to consider selling, while a reading below 30 could suggest an oversold market, potentially signalling a buy opportunity.
The ultimate goal of employing chart indicators is to foresee how prices might change in the future. By interpreting these indicators and recognising patterns or signals, traders gain insights into potential price shifts. This foresight enables them to make timely decisions – be it entering or exiting a trade – aiming to maximise profits during price upswings and mitigate losses during downturns.
Chart indicators Source: Sofien Kaabar, CFA – Medium
Types of Popular Chart Indicators
Before delving deeper into the world of Forex chart indicators, it’s essential to understand the diverse range of tools available to traders. In this section, we’ll explore an array of popular chart indicators, each with its unique characteristics and insights into market behaviour. These indicators serve as essential instruments for traders, providing valuable signals and helping navigate the complex Forex landscape with confidence.
Moving Averages
Moving averages are foundational in technical analysis, smoothing price data for a clear trend representation over a specified time frame. Types include Simple Moving Averages (SMA), Exponential Moving Averages (EMA), and Weighted Moving Averages.
SMAs give equal weight to each price point, suitable for trend identification. EMAs prioritise recent prices, making them responsive to market shifts. Weighted Moving Averages emphasise specific data points, allowing flexible customisation. Traders experiment with these types to match their strategy and market conditions.
Relative Strength Index (RSI)
RSI, a key momentum indicator, gauges both the speed and change of price movements within a given period. By doing so, it provides traders with valuable insights into overbought and oversold conditions, aiding in the assessment of potential trend reversals or continuations.
RSI values above 70 usually suggest overbought conditions, implying a possible price correction or trend reversal, while values below 30 typically indicate oversold conditions, potentially signalling a buying opportunity. This indicator serves as a critical tool in a trader’s toolkit for understanding market sentiment and making informed decisions.
Bollinger Bands Source: Investopedia
Bollinger Bands
Bollinger Bands, a widely-used volatility indicator, consist of a middle band, typically a 20-day simple moving average (SMA), flanked by an upper and lower band. The upper band is calculated by adding two times the 20-day SMA’s standard deviation to the SMA, while the lower band is obtained by subtracting two times the standard deviation from the SMA.
These bands dynamically adjust to market volatility, widening during volatile periods and narrowing during calmer phases. When prices approach the upper band, it may signify overbought conditions, potentially indicating a sell opportunity, while nearing the lower band may suggest oversold conditions, hinting at a buy opportunity.
MACD (Moving Average Convergence Divergence)
MACD is a versatile indicator illustrating the relationship between two moving averages, highlighting changes in market momentum. It’s calculated by subtracting the 26-day exponential moving average (EMA) from the 12-day EMA, resulting in the MACD line. A 9-day EMA of the MACD line, called the signal line, identifies buy or sell signals.
When the MACD line crosses above the signal line, it generates a bullish signal, suggesting a potential uptrend, and vice versa for a bearish signal. The histogram, representing the difference between the MACD line and the signal line, visualises trend strength and direction. Traders use MACD to identify entry and exit points, aiding in informed trading decisions.
Stochastic Oscillator
The Stochastic Oscillator, a momentum indicator, compares a security’s closing price to its price range over a specified time period, typically 14 periods. It generates values between 0 and 100, indicating the closing price’s position within the price range.
A value near 0 indicates that the closing price is at the low end of the range, signifying potential oversold conditions, while a value near 100 suggests the closing price is at the high end of the range, hinting at potential overbought conditions. Traders use this information to identify possible trend reversals or continuation patterns, aiding in strategic decision-making.
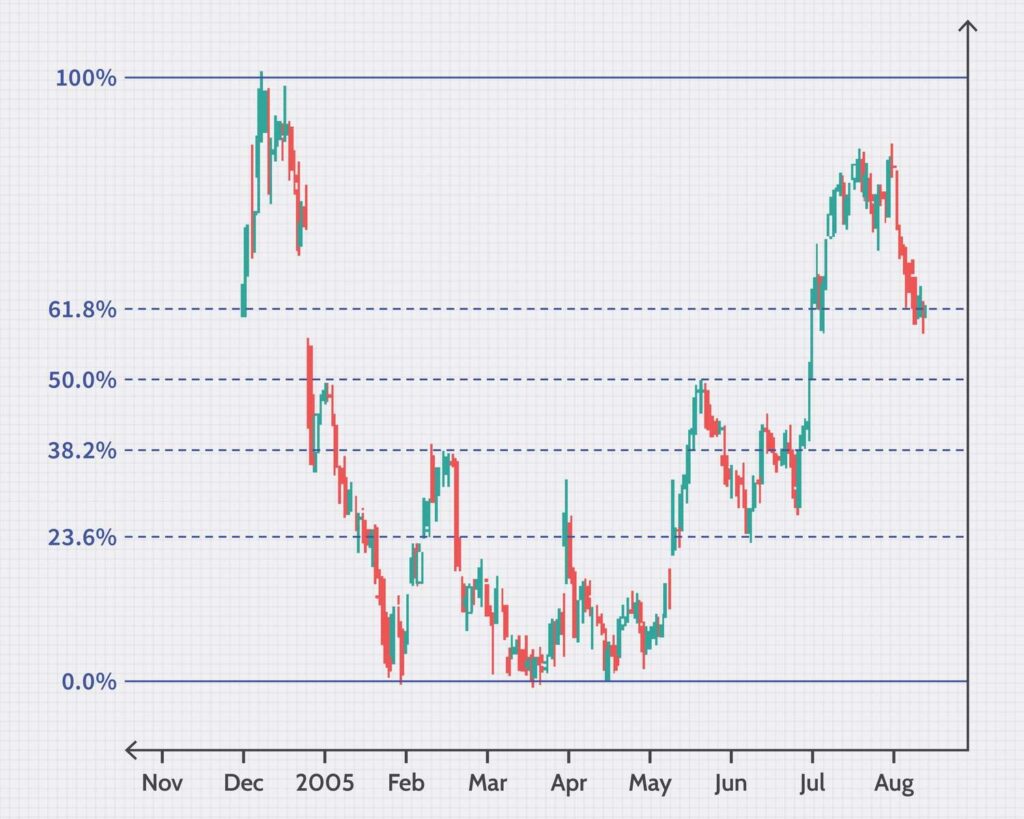
Fibonacci Retracement Source: Investopedia
Fibonacci Retracement
Fibonacci Retracement, a widely utilised tool, employs horizontal lines to identify crucial areas of potential support or resistance based on key Fibonacci levels. These levels – notably 23.6%, 38.2%, 50%, 61.8%, and 78.6% – are derived from the Fibonacci sequence.
Traders utilise these retracement levels to gauge possible points of price reversal or continuation, assisting in making informed trading decisions.
Ichimoku Cloud
The Ichimoku Cloud, a comprehensive technical indicator, offers a holistic view of support/resistance levels, trends, and momentum. It consists of several components, including the cloud (or “Kumo”), Tenkan-sen, Kijun-sen, Senkou Span A, and Senkou Span B.
The cloud represents an area of potential support or resistance, providing traders with valuable insights into market trends and aiding in the identification of potential trade opportunities based on the relationship between the components and the price.
Keltner Channel
The Keltner Channel, a volatility-based indicator, is a powerful tool used to assess market volatility and potential trend reversals. It consists of an upper band, calculated by adding the average true range (ATR) of an asset to a simple moving average (SMA), and a lower band, obtained by subtracting the ATR from the SMA.
When prices approach the upper band, it indicates increased volatility and a potential trend reversal, offering traders valuable information for their trading strategies.
Parabolic SAR (Stop and Reverse)
The Parabolic SAR (Stop and Reverse) is a versatile technical indicator designed to identify potential entry and exit points in a market. It places dots either above or below the price chart, indicating potential trend changes.
When the dots are above the price, it suggests a downward trend, signaling a possible sell opportunity. Conversely, when the dots are below the price, it indicates an upward trend, suggesting a potential buy opportunity. Traders use these signals to make informed decisions and effectively manage their trades.
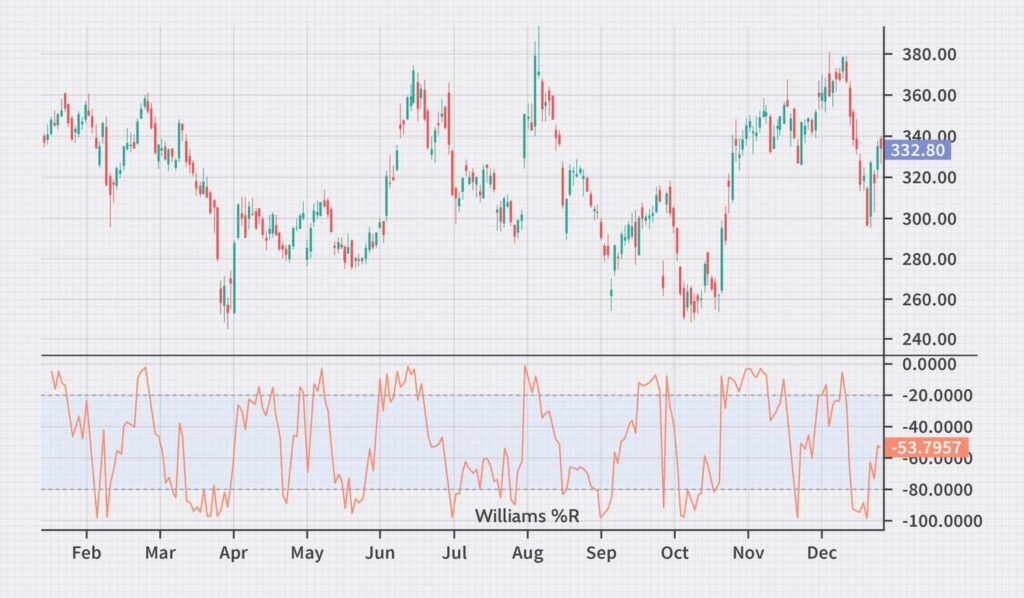
Williams %R Source: Investopedia
Williams %R
Williams %R, an important oscillator, aids traders in identifying overbought or oversold market conditions within a specific timeframe, typically 14 periods. The indicator provides a numerical value between -100 and 0, with values approaching -100 indicating oversold conditions and values nearing 0 indicating overbought conditions.
Traders utilise these readings to make timely decisions, potentially entering a trade when the market is oversold and exiting or shorting when it’s overbought.
Average Directional Index (ADX)
The Average Directional Index (ADX) is a pivotal indicator for traders, measuring the strength of a market trend. It provides a numerical value typically between 0 and 100, with higher values indicating a stronger trend.
When the ADX value is low, it suggests a weak or absent trend, aiding traders in identifying ranging markets. Conversely, a high ADX value signifies a robust trend, assisting traders in assessing the potential for trend-based trading strategies.
A trader using chart indicators Source: Shutterstock
How to Use Chart Indicators Effectively
To optimise chart indicators for effective trading:
Combine indicators: Utilise multiple indicators, like RSI, MACD, and moving averages, to form a comprehensive analysis. This offers a well-rounded view of the market dynamics.
Spot trends and points: Chart indicators help identify trends (up, down, or sideways), potential trend reversals, and precise entry or exit points for trades.
Customise parameters: Adjust indicator parameters, such as period lengths or sensitivity, to suit specific trading strategies and the asset being traded. Tailoring these parameters enhances indicator effectiveness.
Practice and adapt: Continuously practice using indicators and adapt them to changing market conditions. This hands-on experience fine-tunes your understanding and application of these tools, leading to improved decision-making.
In conclusion, understanding popular chart indicators is a crucial step for non-professional traders aiming to enhance their Forex trading strategies. By leveraging these indicators effectively, traders can make informed decisions and navigate the Forex market with increased confidence. Experiment with different indicators and find the ones that align with your trading style and goals, ultimately enhancing your trading success. Best of luck with your trades!