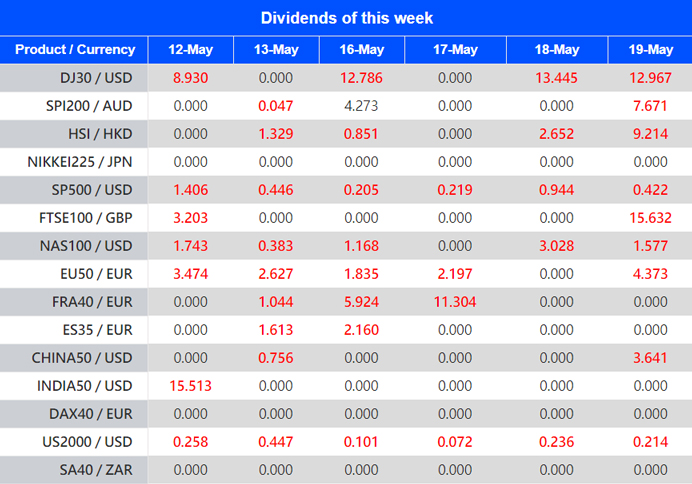
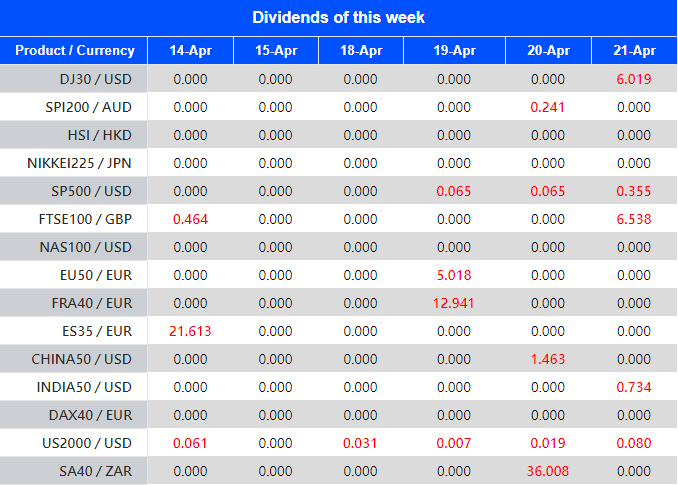
Warmly reminds you that the component stocks in the stock index spot generate dividends. When dividends are distributed, VT Markets will make dividends and deductions for the clients who hold the trading products after the close of the day before the ex-dividend date.
Indices dividends will not be paid/charged as an inclusion along with the swap component. It will be executed separately through a balance statement directly to your trading account, the comment for which will be in the following format “Div & Product Name & Net Volume ”.
Please note the specific adjustments as follows:
Note: The above data is for reference only, the actual execution date may be changed, please refer to the MT4/MT5 software for details.
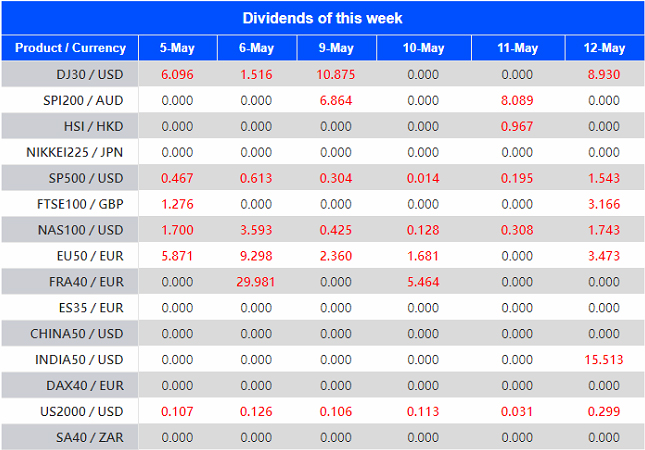
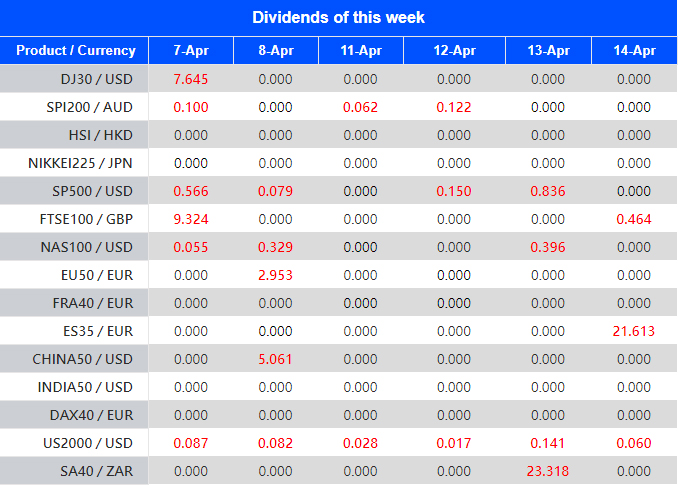
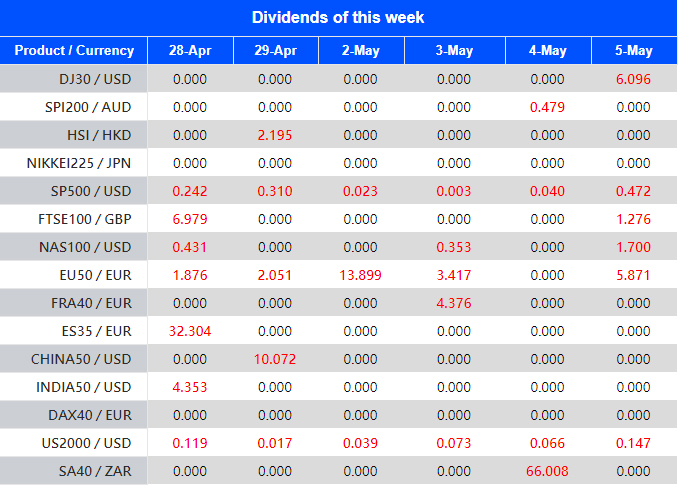
If you’d like more information, please don’t hesitate to contact trading@vtmarkets.com.
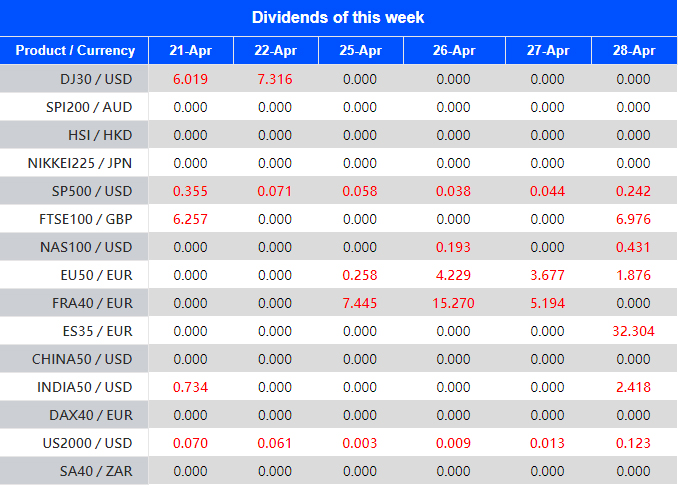
Warmly reminds you that the component stocks in the stock index spot generate dividends. When dividends are distributed, VT Markets will make dividends and deductions for the clients who hold the trading products after the close of the day before the ex-dividend date.
Indices dividends will not be paid/charged as an inclusion along with the swap component. It will be executed separately through a balance statement directly to your trading account, the comment for which will be in the following format “Div & Product Name & Net Volume ”.
Please note the specific adjustments as follows:
Note: The above data is for reference only, the actual execution date may be changed, please refer to the MT4/MT5 software for details.
If you’d like more information, please don’t hesitate to contact trading@vtmarkets.com.
Warmly reminds you that the component stocks in the stock index spot generate dividends. When dividends are distributed, VT Markets will make dividends and deductions for the clients who hold the trading products after the close of the day before the ex-dividend date.
Indices dividends will not be paid/charged as an inclusion along with the swap component. It will be executed separately through a balance statement directly to your trading account, the comment for which will be in the following format “Div & Product Name & Net Volume ”.
Please note the specific adjustments as follows:
Note: The above data is for reference only, the actual execution date may be changed, please refer to the MT4/MT5 software for details.
If you’d like more information, please don’t hesitate to contact trading@vtmarkets.com
You probably know by now that the financial market can be volatile and unpredictable. This is why it’s your responsibility as a trader to learn all the tools, strategies, and disciplines that will help you make intelligent decisions when trading.
One of the key aspects you need to master is technical analysis.
What is technical analysis?
In essence, technical analysis is a strategy or method where past data, such as indicators and price actions, help a trader make the best decision for future trading.
This theory comes from the belief that the buying and selling actions of traders reflect the information related to a particular instrument.
Multiple technical traders also believe that current or past price movements are the most reliable indicators of future price movements.
What are the common mistakes made by traders?
Data accuracy is critical to the efficiency of any technical analysis in trading. So, if you want to be successful at using this strategy, here are some common mistakes that you need to avoid:
You go in without a plan. The technical analysis begins with a good framework that will guide you throughout the gathering and analysing of the data you have. Without one, you’ll only waste your time and resources without getting accurate results.
You want your charts to look good. Of course, we’d like our charts to look good. More than anything, they have to be accurate. As a trader, you don’t want to add indicators to make your chart look perfect. It’s more important to gather data you need and that can influence your trading decision positively.
Mistakes can lead to huge risks that can make or break your trading account. As much as possible, avoid these mistakes when trading to ensure earning potential.
What are the most common technical analysis indicators?
Technical analysis has evolved over the years, with analysts now using different trading systems to help them create forecasts on price movements. Depending on what you want to focus on, a technical analysis indicator can offer information on current market trends, the continuation of these trends, and support and resistance areas.
In general, technical analysts use the most common indicators, including chart patterns, support and resistance levels, price trends, moving averages, and volume and momentum indicators.
What’s the difference between technical analysis and fundamental analysis?
Both technical and fundamental analyses are crucial methods in analysing the markets, although they are at opposing ends of the spectrum.
Fundamental analysis uses methods that attempt to measure the intrinsic value of an instrument. This means analysing data related to industry conditions and the overall economy since they can influence a trade.
On the other hand, technical analysis only uses data from an instrument’s volume and price, following the belief that one can factor all fundamental indicators into pricing. For this reason, there’s no need to look at them. Instead, technical analysis focuses on charts to identify trends and patterns that can influence future trades.
Fundamental analysis takes more time because it looks at more types of data to give a clear picture of the situation of an instrument and its trading potential. Technical analysis offers a faster way to analyse data and make future trading decisions based on them.
Conclusion
As a trader, you must learn how to maximise technical analysis as a tool to build your portfolio, increase your earnings, and create a stable financial future for you and your family. In a competitive world like trading, it is essential to equip yourself with the best trading tools to succeed and protect yourself against losses.
Trade with a regulated multi-asset broker, VT Markets.
Forex orders are an essential part of the trading process. An order is a request to buy or sell a currency at a given price. The type of order you use can affect how quickly you get your desired currency and how much you pay.
This lesson will teach us about the different types of forex orders.
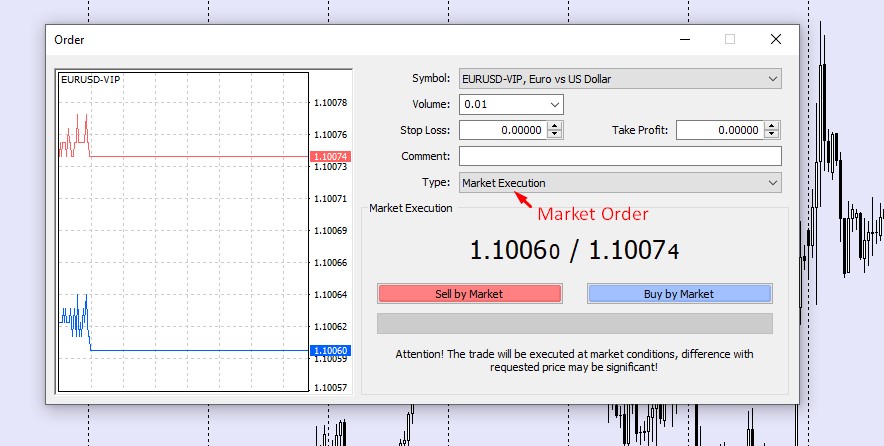
Market Order
A market order is a direct execution. Once you see the price you want, click buy or sell in your platform’s order window.
If you think the price will go up and you want to buy, click “Buy by Market.”
You must remember though that you might get a slippage if you buy something on the market.
What is slippage?
Slippage refers to the contrast between the expected price of a trade and the price at which it was executed. The term is used in all trading markets but is most common in Forex and futures markets.
This difference can be due to many factors, such as market volatility, liquidity issues, or high-frequency trading. Slippage can also occur when there are too many orders to fill at one time.
For example:
Let’s say the price is 0.71533, and you want to sell at that price. When you click “Sell by Market”, you would expect the same price at 0.71533. But because of slippage, you’ll get 0.71534 instead, which is slightly better. This is because the market moves so quickly that the price already shifted when you clicked.
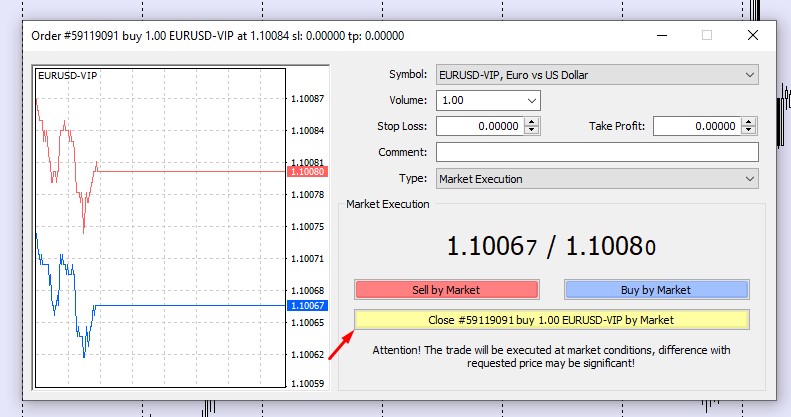
To close a position using the market order, you can open the same order page by clicking on the open position in the terminal section on the MT4. The exact order page will open up.
Source: VT Markets MT4
The image above says, “Close #18501322 sell 1.00 AUDUSD-ECN by Market” in yellow. Click on that, and remember that when you close a Sell position, you will get the Ask price, which is, in this case, 0.71504 (take note that it may get slippage too).
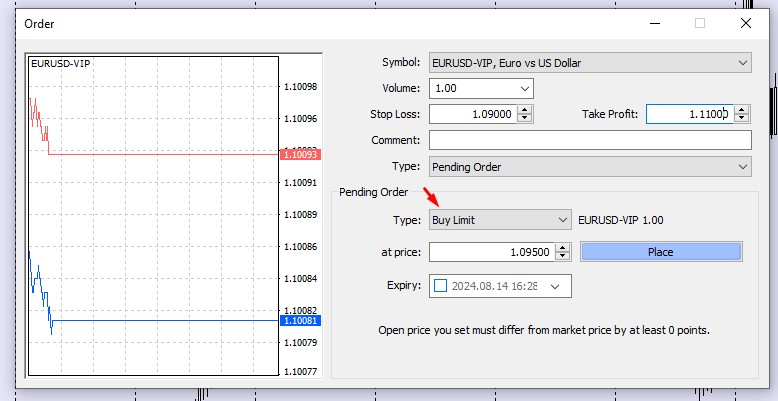
Limit Order
A limit order is a pending order you place when seeking a better entry price. There are two options: Buy Limit and Sell Limit.
Source: VT Markets MT4
Buy Limit Order – Set a Buy Limit if you wish to buy below the current price.
Source: VT Markets MT4
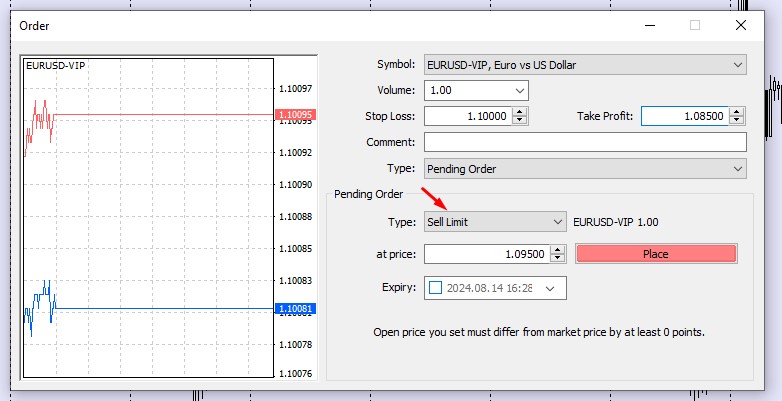
Sell Limit Order -Set a Sell Limit if you want to sell above the current price.
For example, if the market is moving in a range, you may notice that they always rebound at similar price levels.
As shown in the illustration, the price always bounces back up when it reaches a lower level and then falls when it comes to a higher level.
After some research, you might find out that this range movement will continue for some time, and you wish to benefit from it.
The price is now trading in the midway of those levels. So, rather than waiting for the price to reach those levels, you can set a Sell limit at the higher level or a Buy limit at the lower level.
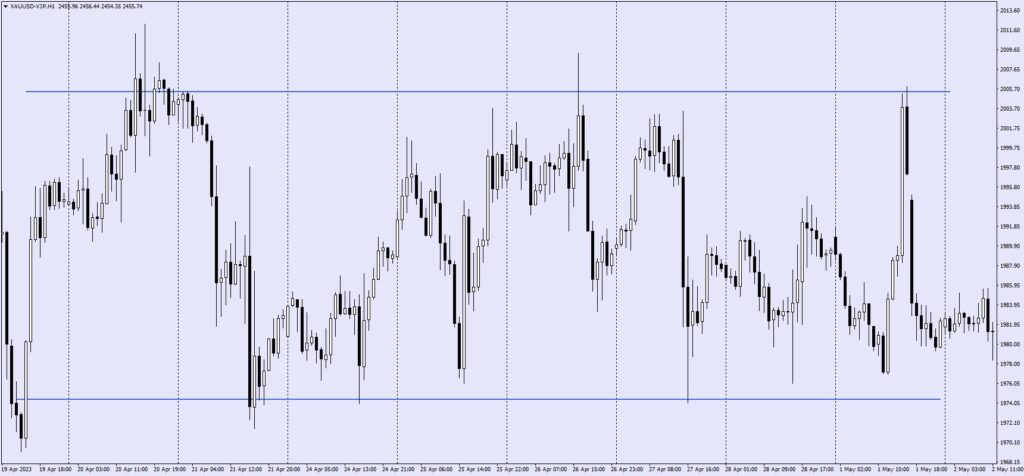
Consider the following example:
Source: VT Markets MT4
As you can see from this chart, there is a range movement with some higher and some lower highs and lows.
It also shows that the price is currently moving in the middle. Supposing you want to open a buy position, but you want to buy near the lower levels. So you decide to put a Buy Limit Order above the lower levels.
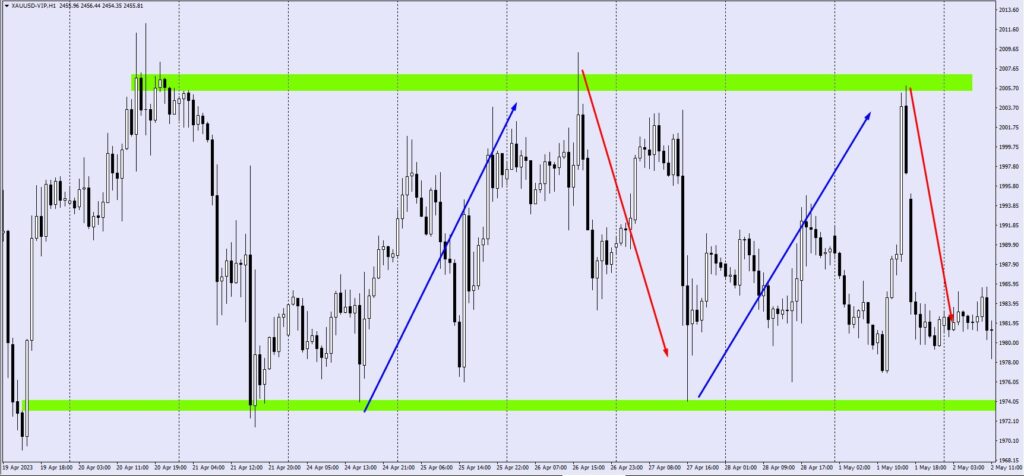
Source: VT Markets MT4
After the price moves, as shown in the chart above, you may have correctly analyzed it. Your Buy Limit Order has converted to a Buy Order automatically.
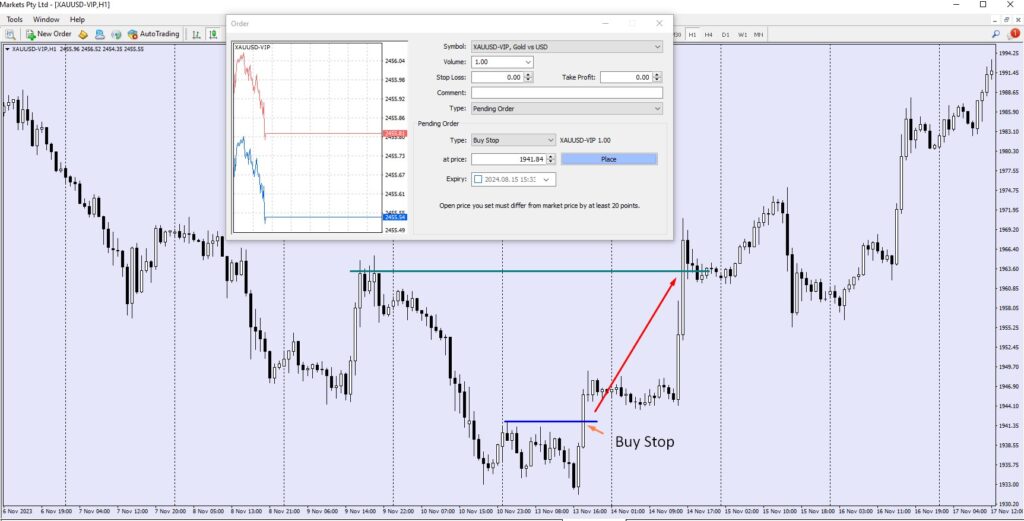
Stop Order
A stop order is a pending order that you place when you feel a particular price will result in market continuation. There are two options:
Place a Buy Stop if you want to buy above the current price.
Place a Sell Stop if you want to sell below the current price.
Source: VT Markets MT4
As a result, when the price reaches specified levels, the position will automatically open for Buy or Sell at a price stated in the orders.
Therefore, if we look at the sample above, we can see a ranging movement and two borders, one higher and one lower. That border will eventually be broken if the price begins to trend.
After some analysis, you concluded that if the price breaks through the upper border, it will continue to rise until it reaches the target level. Thus, you can place a Buy Stop order above the higher border, assuming that you will automatically open a Buy position if the border breaks. If the market continues to rise, you will profit.
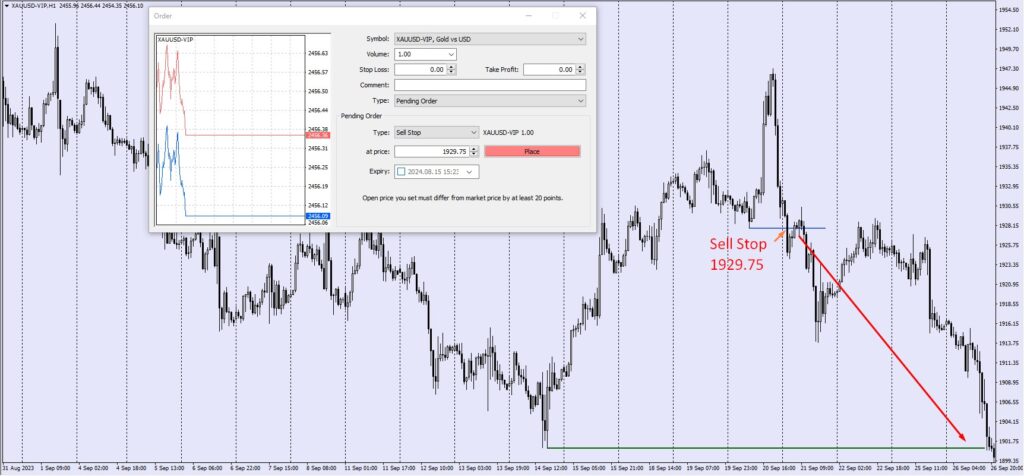
You may also have determined that if the price breaks through the lower border, it will continue to rise until it reaches the target level. Therefore, you can place a Sell Stop order for this below the lower border, assuming that if the border breaks, you will automatically open a Sell position. If the market continues to decline, you will profit.
Source: VT Markets MT4
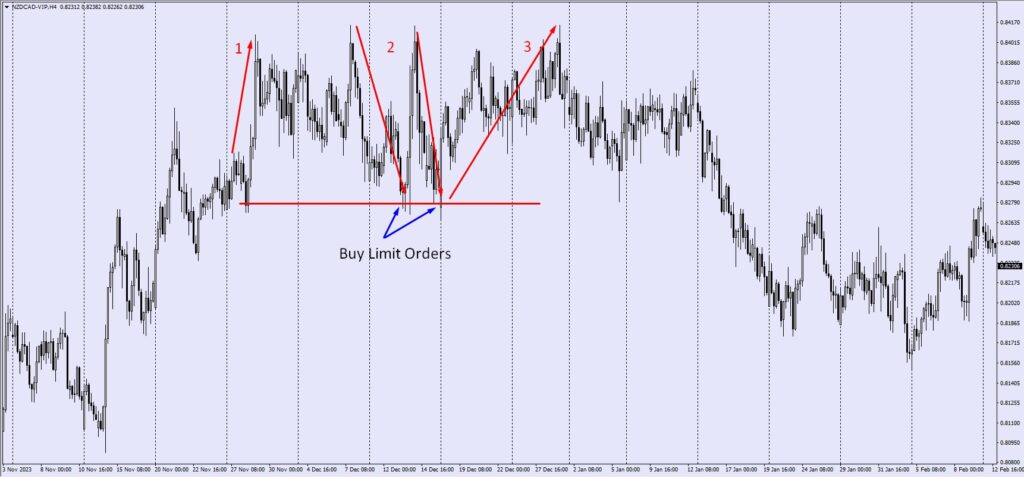
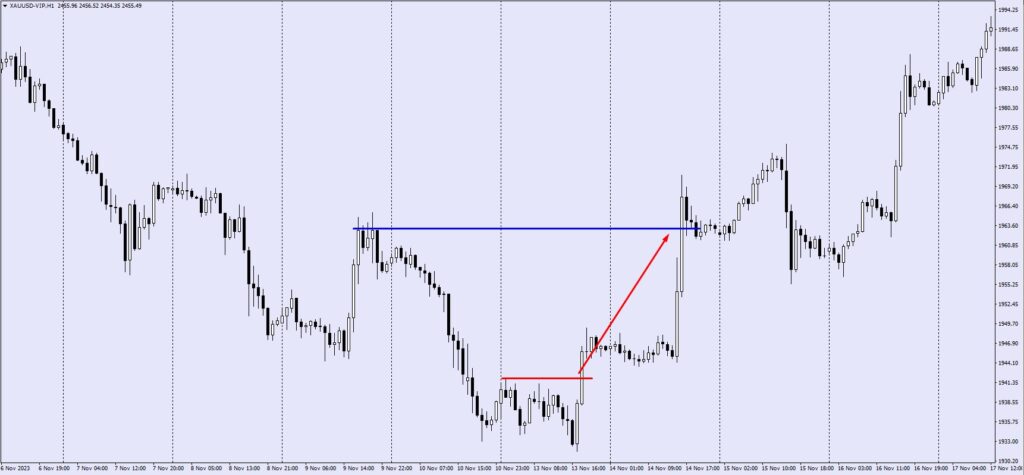
Consider the following example:
Source: VT Markets MT4
As you can see from this chart, there is a range movement with some higher and some lower highs and lows.
Assuming that the price would rise when it breaks through the higher levels, you place a Buy Stop Order above the higher levels.
Source: VT Markets MT4
After the price moves in the way shown in the chart above, you may have correctly analyzed it. Your Buy Stop Order has converted to a Buy Order automatically.
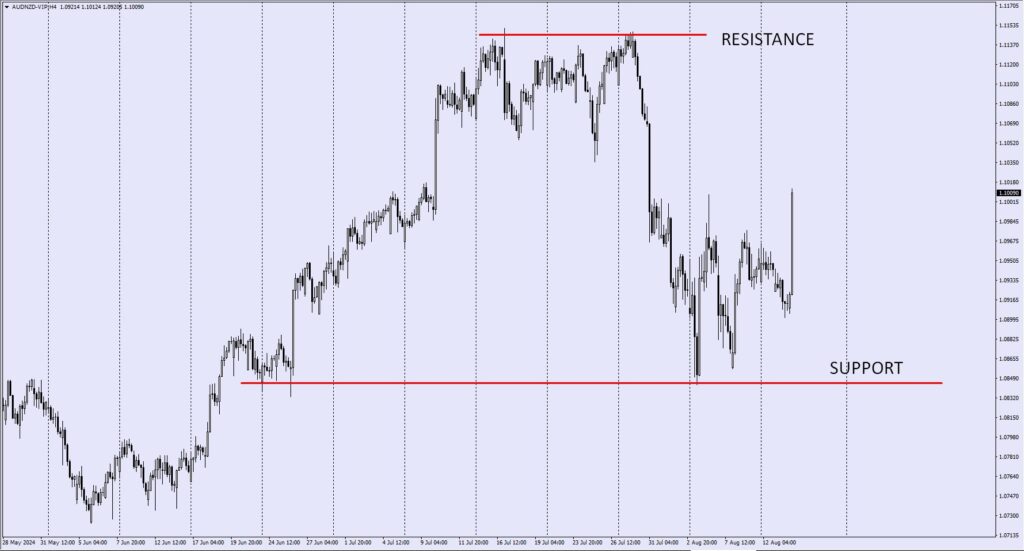
These higher and lower levels are commonly referred to as Support and Resistance Levels, which will be tackled in the next lesson.
It is critical to observe the movement of prices in Forex trading. There are several ways to accomplish this, including seeing the ticker in real-time. But the most popular method is to display prices on a chart, which enables you to observe how prices respond at crucial moments.
Traders use prominent chart types, including line charts, candlestick charts, and bar charts. Each chart type presents data uniquely and has distinct advantages.
Line Charts
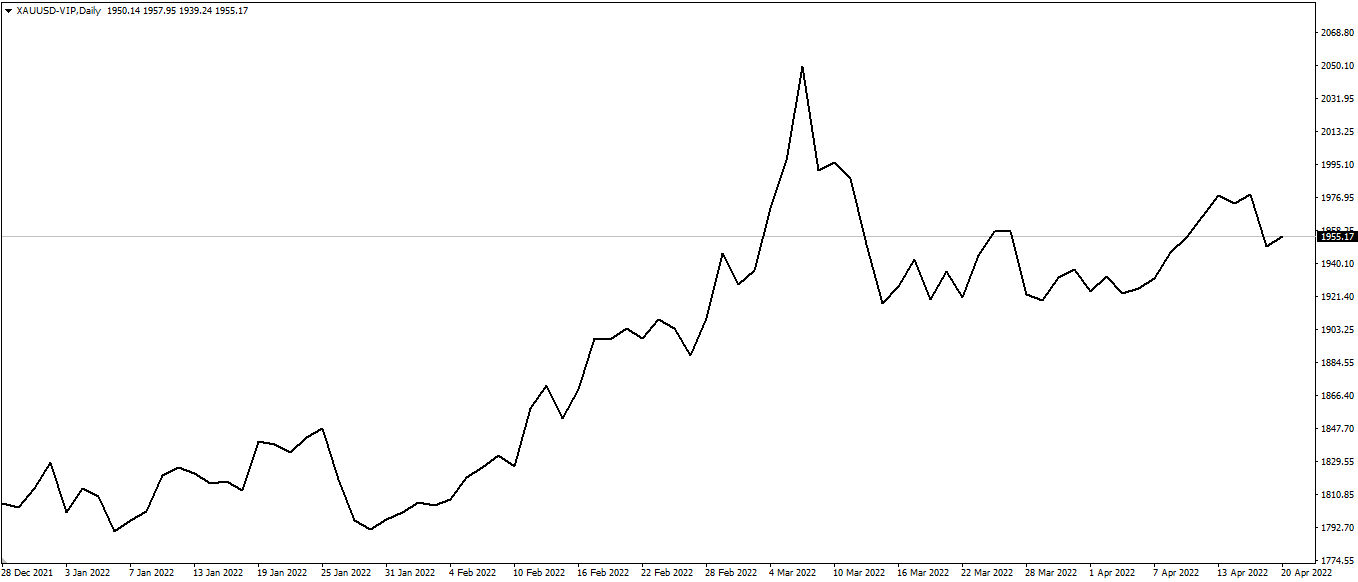
Line charts are the most straightforward to understand, primarily because line charts only display closing prices. Thus, they eliminate “noise” generated by less crucial trading times of the day, such as the open, high, and low. Line charts typically depict a single line that connects all of the period’s closing values – the following is an example of how the XAUUSD daily line chart looks:
Source: VT Markets MT4-VIP
Since closing prices are often seen as the most relevant, it’s easy to see why investors and traders like line charts.
Line charts provide a concise, simplified snapshot of the current market condition and are typically the best choice for individuals seeking a fast glimpse of the market’s direction.
Bar Charts
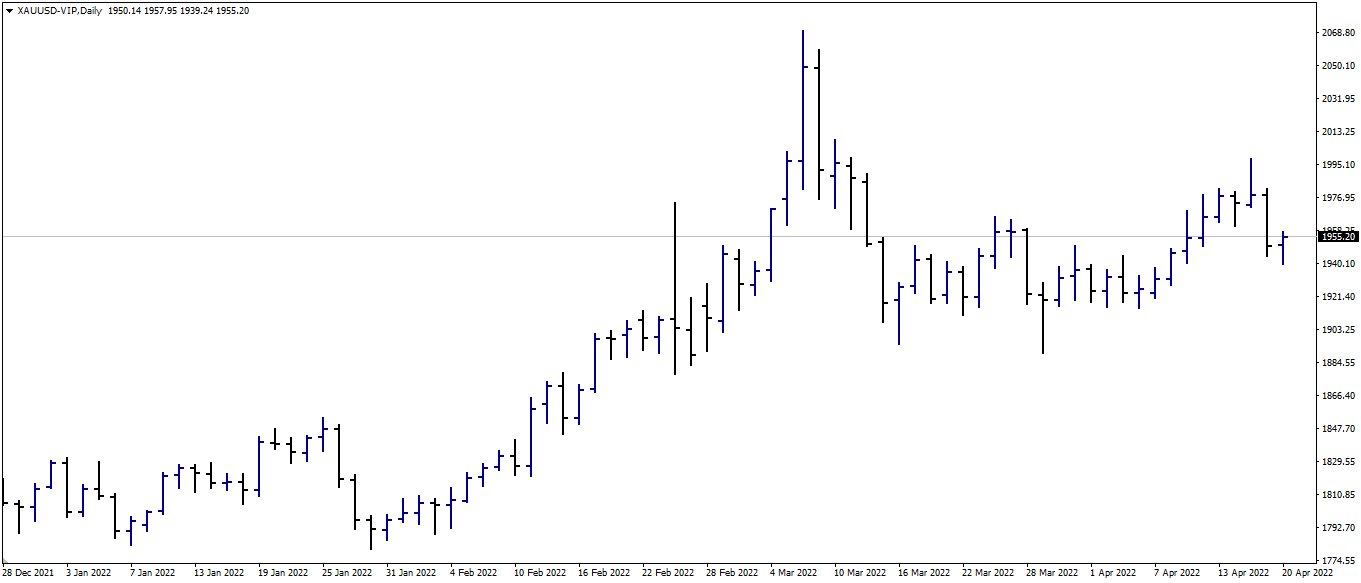
Bar charts, commonly called OHLC charts, depict four critical points: the Open, High, Low, and Close (OHLC) of a given period. Consider it an enhanced version of the line chart, as it reveals additional information that can be used to aid in trade research and uncover additional information about specific price moves.
For instance, if the space between the Open and Close bars is vast, it indicates that the price made a significant move during that bar. Combining a few of these might indicate a period of extreme volatility.
Source: VT Markets MT4-VIP
Not only can you see how prices are displayed in terms of bars in the same XAUUSD chart example above, but you can also see how there are periods of high and low volatility. This is very important in trading because it identifies periods and locations of high interest and indecision.
Candlestick Charts
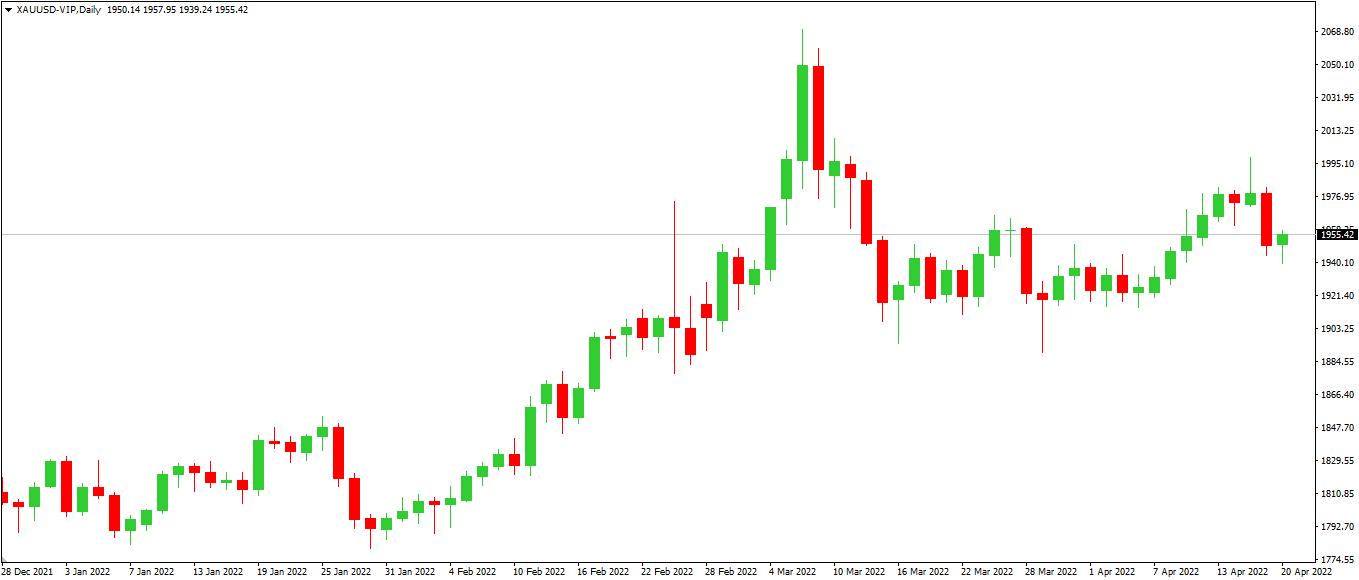
The candlestick chart is the most popular type of chart. Candlestick charts are composed of two distinct components: the body and the shadows (wick). The top and bottom of the body provide information about the opening and closing prices over the specified period. The shadows at the top and bottom indicate the highest and lowest prices reached within the specified period.
Candlestick charts, like bar charts, display the Open, High, Low, and Close in a different format. Indeed, many traders regard the candlestick chart as an enhanced version of the bar chart, as the additional information displayed allows for the creation of candlestick patterns (more on that later), which enables us to read the markets in ways that bar charts and line charts do not.
Typically, the candle body will be red if the closing price is less than the opening price. The body will be green if the closing price exceeds the opening price. In this scenario, red candlesticks indicate a price decline, while green candlesticks indicate a price increase.
Source: VT Markets MT4-VIP
Using the same XAUUSD example, you can observe how prices seem different on a candlestick chart.
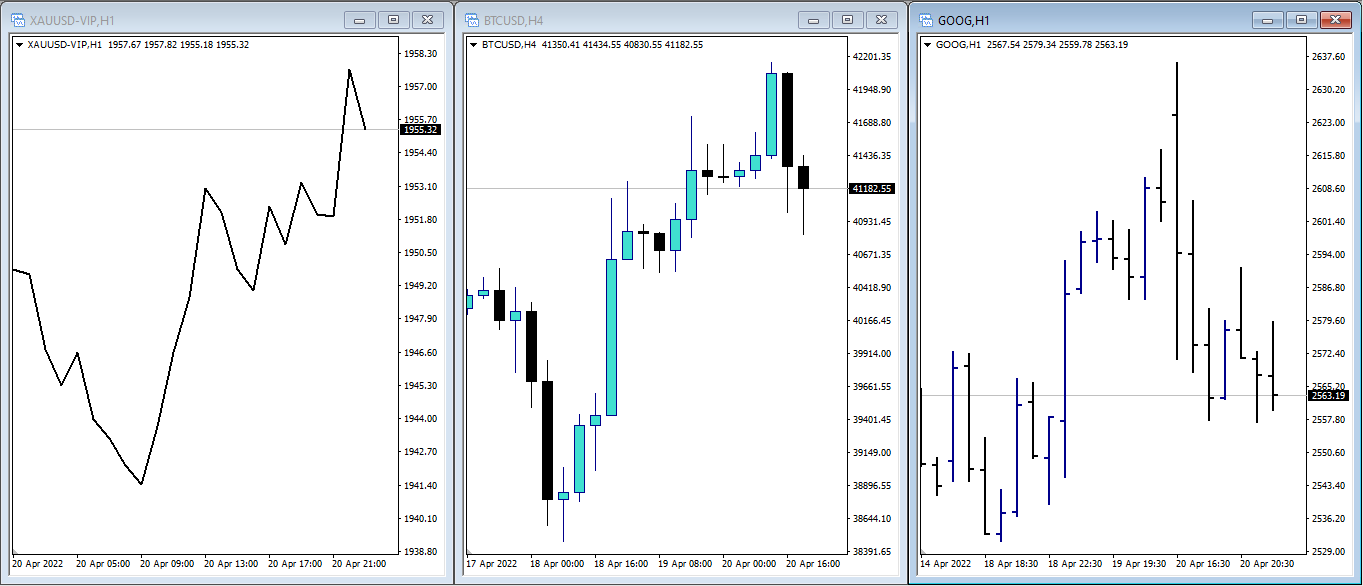
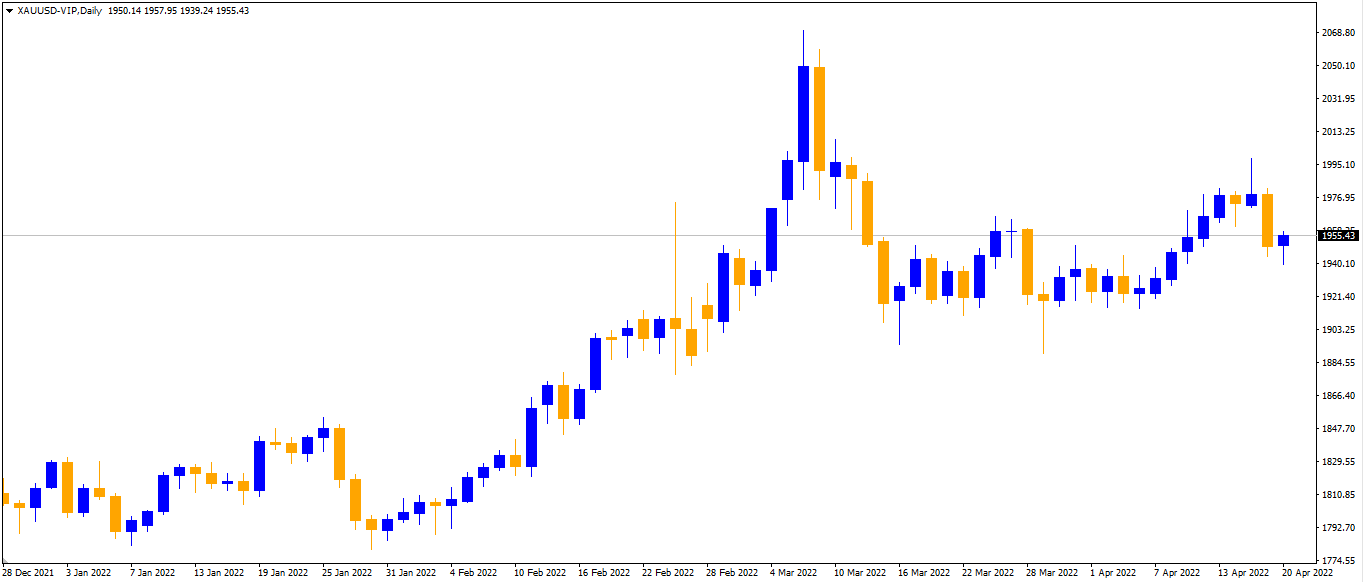
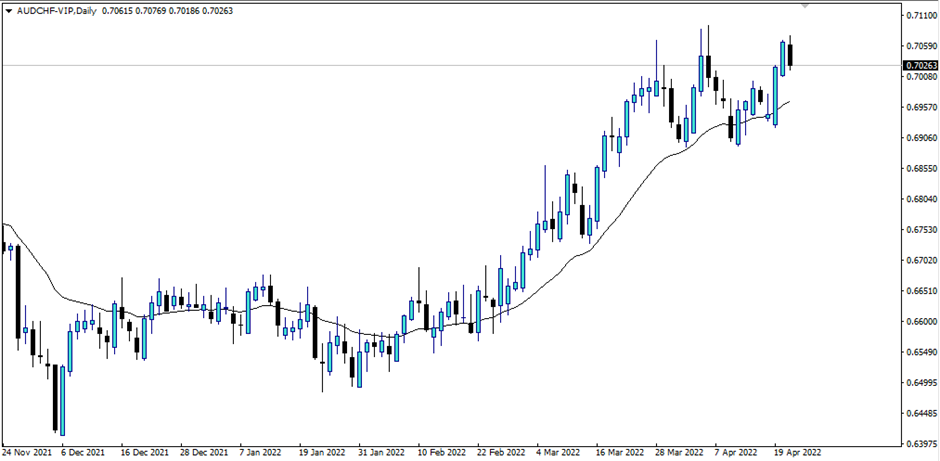
Important note: While red and green are typical colours for displaying falling and rising values, additional combinations such as black/white or blue/orange (like the sample below) may exist.
Source: VT Markets MT4-VIP
The most important thing is to know why they are formed so that the colours representing them can make it easier for us to figure out what they mean.
FAQ:
Q: What are the main types of trading charts in forex?
A: The main types of trading charts are line charts, bar charts, and candlestick charts. Each offers unique insights into price movements.
Q: What is a line chart?
A: A line chart connects closing prices over a set period, providing a clear view of the overall price trend.
Q: What is a bar chart?
A: A bar chart shows the open, high, low, and close prices for each time period, giving a detailed view of price fluctuations.
Q: What is a candlestick chart?
A: A candlestick chart displays the open, high, low, and close prices in a visually engaging format, helping identify market trends and patterns.
Q: How do candlestick patterns help in trading?
A: Candlestick patterns can indicate potential market reversals or continuations, aiding traders in making informed decisions.
Q: Which chart type is best for beginners?
A: Line charts are generally best for beginners due to their simplicity and ease of understanding overall trends.
Q: Can I switch between different chart types on trading platforms?
A: Yes, most trading platforms, including MetaTrader 4 and MetaTrader 5, allow you to switch between various chart types easily.
Q: How often should I check trading charts?
A: The frequency of checking trading charts depends on your trading strategy. Day traders may check charts frequently, while long-term traders may review them less often.
Q: Do trading charts work for all time frames?
A: Yes, trading charts can be used for various time frames, from minutes to months, depending on your trading strategy.
Q: What tools can help analyze trading charts?
A: Technical indicators like moving averages, RSI, and MACD can help analyze trading charts and identify potential trading opportunities.
Ready to master different trading charts? Open a demo account with VT Markets today and practice using line, bar, and candlestick charts to enhance your trading skills!
When it comes to trading, you’ll likely often hear about MT4. What is it exactly?
MetaTrader4 (MT4) is a popular online trading platform that traders can use to automate their trading. Its simple user interface gives access to advanced technical analysis and flexible trading systems.
Here’s a guide on what MetaTrader 4 is and how to use it.
MT4 is an acronym for MetaTrader 4, one of the world’s most widely used trading platforms for Forex trading. Indeed, you may trade a wide variety of items on it, including:
Indices (such as S&P 500, Nasdaq, etc.)
CFDs on shares (such as Apple, Netflix, Tesla, and Amazon)
Commodities (such as Soybean, Coffee)
Precious Metals (such as Gold, Silver, Platinum, and Copper)
Bitcoin and other cryptocurrencies (such as BTCUSD and ETHUSD)
MT4 Functionalities
MT4 includes all of the standard trading platform functionalities you’d expect, including products/symbols, various chart types and customization options, useful entry options, and comprehensive and accurate historical trade tracking. It also features a handy back tester for evaluating how different trading strategies would have performed against historical data.
Most importantly, it’s effortless and straightforward to use.
Once you’ve mastered the basics of MT4, you’ll want to explore further the platform’s technical indicators and trading robots (known in the industry as Expert Advisors).
Numerous traders prefer to use the company’s popular coding language (MetaQuotes Language) to develop their specialized tools and algorithms for trading.
This has resulted in the development of a booming marketplace where you can purchase automated trading programs suited to specific techniques that will assist you in trading!
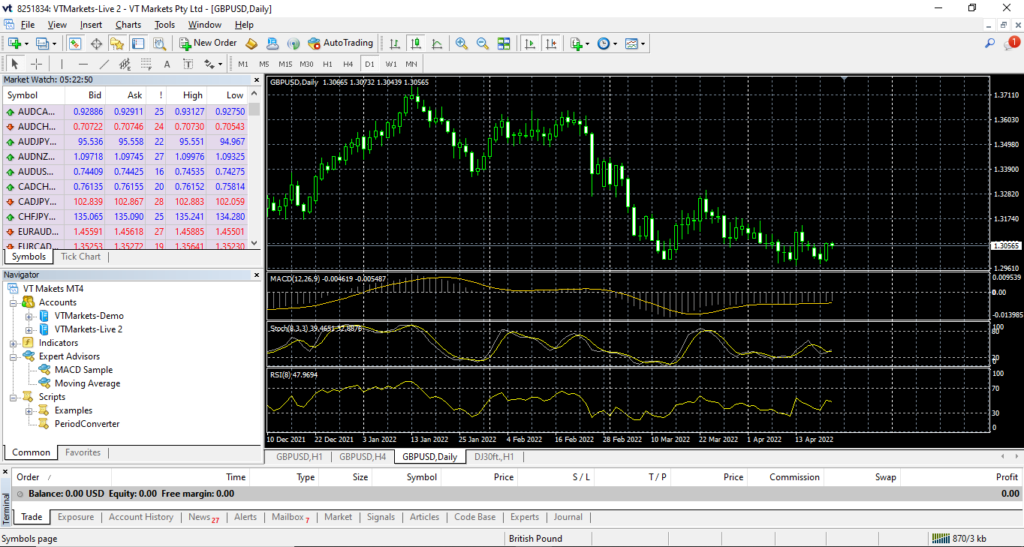
After you install MT4 on your computer desktop/laptop, you will be prompted to an initial display. See below:
VT Markets MT
Menus and Toolbars
The first is the menu and toolbar section. In this section, you can see all the tools and features available at MT4.
Menu – File
On this menu, you can find commonly used tabs, such as:
New Chart – to open a new chart by choosing the desired instrument.
Profiles – to open the profile.
Save as Picture – to submit the chart in the form of “BMP” or “GIF”.
Open an account – to open a new account demo, log in to enter the account that you already have.
Menu – View
This menu contains the toolbars we need, such as a market watch, terminal, and change language. All the toolbars we choose will appear on the MT4 main layer, and several toolbars will appear below the menu.
Menu – Insert
This menu is to enter indicator-indicator and object-object needed on the chart section. We can use the indicators available. Even the book of ISA uses the indicator we have.
Menu – Charts
This menu is used to change the display on the chart, tailored to what we want, such as choosing a chart type, selecting a timeframe, zooming in, chart shift, and others.
Menu – Tools
This menu is used to access history libraries, do new orders, and open the Metaquotes Language Editor. We can also change the password, set the server, and others in the options section.
Menu – Window
Use this menu to set the main screen display, especially if you have several charts that are open simultaneously.
Menu – Help
This menu is the Help menu in general which contains all the things you need to know about MT4.
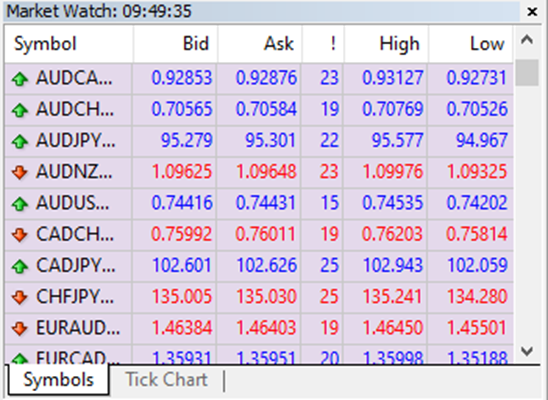
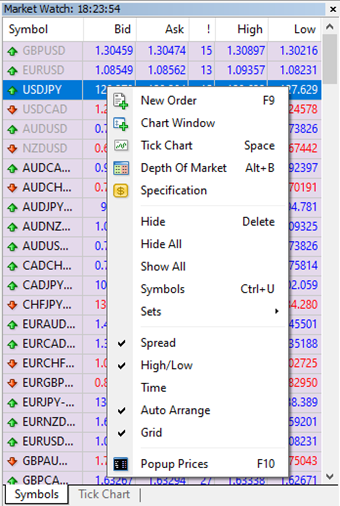
Market Watch
Market Watch is a part that displays prices from instruments available on the broker. You can access this display through the View menu or “Ctrl + M”.
Market Watch is a part of MT4 that contains information for you to trade, such as placing your first trade through MT4 and choosing from Forex, commodities, indices, CFD equities, and even crypto.
It also contains other features, such as opening a new position, the window chart, and looking for symbols.
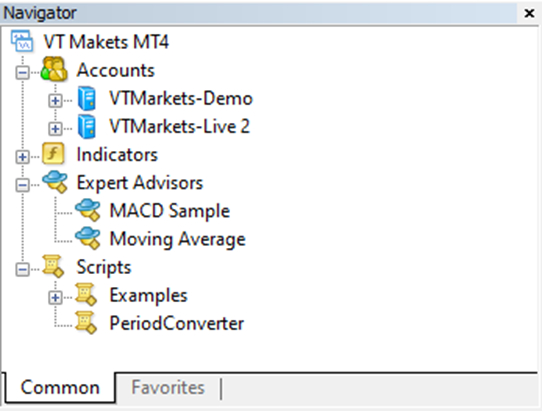
Navigator
This part gives you quick access to various features of the terminal. This window can be opened/closed by pressing Ctrl + N by the “View – Navigator” menu OR by pressing the “Navigator” Window Button of the “Standard” Toolbar.
The list of features is accessible through a dropdown arrow and contains five groups: Accounts, Indicators, Expert Advisors, Custom Indicators, and Scripts.
Accounts
The “Accounts” group includes the list of Open Accounts. One can open a new demo account or delete the old one.
Indicators
Indicators are primary tools for analyzing price movements, which include built-in indicators, community indicators purchased from the market, custom indicators, and more.
Expert Advisor
This menu contains a list of all available expert advisors. Expert advisors in the terminal are programs that allow automating analytical and trading activities.
Terminal
The terminal menu is a multifunctional window allowing access to various terminal features. This window allows control over trading activities, views news and account history, sets up alerts, and works with the internal mail and system journal.
The window can be opened by the “View – Terminals” menu by pressing Ctrl + T or the “Terminal” window button of the Standard Toolbar.
Several tabs are found here:
Trade: Traders can view the status of open positions and pending orders as well as manage all trading activities here. The total financial result for all open positions is also published in this tab.
Exposure: This tab contains the summary information about the state of assets by all open positions.
Account History: This tab shows the history of all performed trade operations and balance without considering open positions. One can estimate the efficiency of all trade activities with the results given in the tab.
Alerts: Various alerts can be viewed and set here. Any files executable in the operational environment (including wave files) and messages sent by email can be used as alerts.
Signals: This tab displays trading signals of the “Signals” service, which are available for subscription.
CodeBase: Here, you can download any application published in the “CodeBase” section of the MQL5 community website.
Expert Advisors: Information about the functioning of the attached expert, including opening/closing of positions, order modifying, the expert’s messages, etc., are published in this tab.
Journal: Information about terminal launching and events during its operation, including all trade operations performed, is stored in the journal.
Chart Window
In this section, you can see the price movement in the form of a chart. You can add indicators, Expert Advisor, or object that you feel can help your trading journey.
Now that you know more about the MT4, you can start navigating your way and use these features when trading.
FAQ:
Q: What is MetaTrader 4 (MT4)?
A: MT4 is a popular trading platform used by forex traders. It offers tools for technical analysis, trading signals, and automated trading.
Q: How do I install MT4?
A: Download MT4 from your broker’s website, run the installer, and follow the prompts to complete the installation.
Q: What are the key features of MT4?
A: MT4 features include advanced charting tools, multiple timeframes, technical indicators, Expert Advisors (EAs), and real-time market data.
Q: Can I use automated trading on MT4?
A: Yes, MT4 supports automated trading through Expert Advisors (EAs), which allow you to execute trades based on predefined criteria.
Q: How do I place a trade on MT4?
A: To place a trade, open the ‘New Order’ window, select your currency pair, set the volume, and choose ‘Buy’ or ‘Sell.’ You can also set stop-loss and take-profit levels.
Q: How can I customize my charts on MT4?
A: Right-click on the chart, select ‘Properties,’ and adjust the settings as desired. You can change colors, add indicators, and set timeframes.
Q: Is MT4 available on mobile devices?
A: Yes, MT4 has mobile apps for both iOS and Android, allowing you to trade on the go.
Ready to enhance your trading skills with MetaTrader 4? Open a demo account with VT Markets today and explore the powerful features of MT4. Start your trading journey now!