Le obbligazioni sono uno degli asset finanziari più popolari, ma se non hai mai esplorato cosa sono e come funzionano, potresti essere stato scoraggiato dalla loro reputazione di essere complesse o un asset a basso rendimento.
In realtà, le obbligazioni sono un asset ampiamente scambiato che può rafforzare il profilo di rendimento del rischio del tuo portafoglio e aggiungere diversificazione senza esporti a eccessiva volatilità. Il loro presunto basso rendimento è bilanciato dall’essere un’opzione a basso rischio e sicura per gli investitori, e la loro relazione inversa con i tassi di interesse offre anche alcune opportunità redditizie per il trading di CFD sulle obbligazioni.
In questo articolo, spiegheremo cosa sono le obbligazioni, quali tipi sono disponibili per il trading e come puoi aggiungere questo asset al tuo portafoglio, diversificandolo oltre le sole azioni.
Cosa sono le obbligazioni?
Le obbligazioni, nei termini più semplici, sono un tipo di strumento di debito. Mentre le persone potrebbero rivolgersi a una banca o a una cooperativa di credito per un prestito, le aziende e i governi possono raccogliere capitale rivolgendosi agli investitori, che diventano obbligazionisti dell’organizzazione. Gli obbligazionisti pagano un interesse sull’asset, noto come tasso cedolare, fino alla scadenza dell’obbligazione – con ‘scadenza’ si intende la data in cui l’importo iniziale del prestito (noto come capitale) viene rimborsato.
Le obbligazioni sono considerate meno rischiose rispetto ad altri asset più volatili, ma comportano alcuni rischi associati ai tassi di interesse (cedolari), crediti, insolvenze e rimborsi anticipati. Esistono diversi tipi di azioni a seconda dell’organizzazione, azienda o istituzione che le ha emesse, ma tutte sono valutate per il loro grado di investimento.
Quali tipi di obbligazioni esistono?
Le obbligazioni possono essere sia garantite che non garantite. Un’obbligazione garantita protegge l’obbligazionista in caso di inadempienza dell’emittente, offrendo beni come garanzia. I titoli garantiti da ipoteche sono un esempio di obbligazione garantita.
Le obbligazioni non garantite, d’altro canto, non sono sostenute da alcuna garanzia. Sono anche conosciute come debenture e sono considerate asset più rischiosi perché sia l’interesse che il capitale sono garantiti solo dalla società o organizzazione emittente.
Esistono quattro tipi di obbligazioni:
Obbligazioni governative — Sebbene alcune obbligazioni emesse dal governo siano non garantite, sono considerate tra gli investimenti a più basso rischio sul mercato, quando provengono da governi stabili che non hanno mai fatto default su un debito obbligazionario. Negli Stati Uniti, le obbligazioni governative sono note come Treasuries, mentre nel Regno Unito sono chiamate gilts.
Obbligazioni aziendali — Le obbligazioni aziendali, come suggerisce il nome, sono emesse dalle aziende. Vengono utilizzate per raccogliere fondi per le aziende e, a seconda delle dimensioni e della natura consolidata dell’azienda, possono essere considerate di rischio maggiore o minore.
Obbligazioni municipali — Simili alle obbligazioni governative, le obbligazioni municipali, o munis, sono emesse da municipi, consigli, città e altri enti locali.
Obbligazioni di agenzia — Le obbligazioni di agenzia sono definite come titoli, emessi da imprese sostenute dal governo o da altri dipartimenti del governo federale diversi dal Tesoro USA.
Entrambe le obbligazioni dell’Associazione Nazionale di Mutui Fannie Mae e le obbligazioni del Federal Home Loan Mortgage Freddie Mac sono esempi di obbligazioni GSE.
Come funzionano le obbligazioni?
Le obbligazioni sono semplici strumenti di debito. Regolano il processo attraverso il quale un obbligazionista presta denaro (noto come capitale o valore nominale) a un’istituzione pubblica o privata (nota come l’emittente), e l’emittente poi lo rimborsa su base annuale, semestrale o mensile, come previsto nei termini dell’obbligazione. Quando l’obbligazione raggiunge la maturità — la sua data di scadenza — il capitale viene restituito all’obbligazionista.
Poiché le obbligazioni sono ciò che si definisce titoli negoziabili, possono essere comprate e vendute in un mercato secondario, in modo molto simile alle azioni (anche se va notato che azioni e obbligazioni funzionano in modo abbastanza diverso). Alcune obbligazioni sono quotate in borsa; tuttavia, la maggior parte delle negoziazioni di obbligazioni avviene attraverso l’uso di OTC (prodotti over-the-counter) come i CFD (contratti per differenza), che vengono negoziati tramite broker.
Come tutti gli strumenti di debito, le obbligazioni dipendono fortemente dai tassi di interesse per determinare il loro prezzo. In generale, gli aumenti dei tassi di interesse riducono la domanda di obbligazioni, poiché gli investitori cercano tassi di interesse migliori altrove. In periodi di tassi di interesse decrescenti, la domanda di obbligazioni aumenta inversamente e i loro prezzi salgono.
Caratteristiche delle obbligazioni
Ci sono certe caratteristiche che distinguono le obbligazioni da altri asset e strumenti di debito. Queste sono: maturità e durata, rating di credito, valore nominale e prezzo di emissione e tassi e date cedolari.
Maturità e durata — Questi due termini potrebbero sembrare interscambiabili, ma maturità e durata sono in realtà diversi. La maturità di un’obbligazione si riferisce al suo termine attivo, cioè alla durata fino alla sua scadenza e al suo pagamento finale.
La durata, d’altro canto, si riferisce sia a un periodo di tempo sia a una misura della sensibilità del prezzo di un’obbligazione alle variazioni del tasso di interesse. La durata di Macaulay di un’obbligazione è il tempo effettivo necessario per rimborsare il suo capitale, espresso in anni. La durata di Macaulay viene utilizzata per calcolare la durata modificata di un’obbligazione, perché più tempo ci vuole per estinguere un’obbligazione, più sarà vulnerabile alle fluttuazioni dei tassi di interesse. La durata modificata è l’espressione di tale vulnerabilità dell’obbligazione.
Rating di credito — Un rating di credito essenzialmente ‘valuta’ tutte le obbligazioni su una scala di affidabilità creditizia. Come menzionato, le agenzie di rating sono gli enti che producono questi rating — come Standard & Poor’s e Fitch Ratings, ad esempio.
Il rating di credito è utile per gli emittenti perché può aiutare a pubblicizzare l’attrattività di un’obbligazione agli investitori. Allo stesso modo, sono uno strumento prezioso per valutare il rischio di un’obbligazione per potenziali obbligazionisti. Le obbligazioni a lungo termine a basso rischio ricevono la valutazione più alta possibile AAA, mentre le obbligazioni valutate al di sotto del grado di investimento sono valutate da BB+ in su (queste sono anche conosciute come obbligazioni spazzatura).
Valore nominale — Il valore nominale, o capitale, è l’importo che l’emittente si impegna a pagare all’obbligazionista, al netto di eventuali pagamenti del tasso cedolare (o di interesse). Di solito, il valore nominale viene pagato in un’unica somma alla scadenza dell’obbligazione e non fluttua nel prezzo da quando viene inizialmente fissato. Esistono alcune eccezioni a ciò, come i TIPS (Treasury Inflation-Protected Securities), che vengono aggiustati in linea con i dati sull’inflazione.
Il prezzo di emissione dovrebbe teoricamente essere lo stesso del valore nominale di un’obbligazione, perché entrambi rappresentano il valore pieno del prestito. Dove il prezzo di emissione può differire, tuttavia, è sul mercato secondario, dove il prezzo di emissione di un’obbligazione può fluttuare significativamente.
Tassi cedolari e date — Il tasso cedolare, o tasso di interesse, di un’obbligazione è l’interesse pagato agli obbligazionisti, solitamente su base annua o semestrale. È conosciuto anche come rendimento nominale. Il tasso cedolare viene calcolato dividendo i rimborsi annuali dell’obbligazione per il suo valore nominale completo.
Le date cedolari regolano gli intervalli in cui si verificano questi pagamenti cedolari. Possono essere mensili, semestrali, annuali o trimestrali, ma saranno specificati dall’obbligazione.
Cosa influenza i prezzi delle obbligazioni?
I prezzi delle obbligazioni sono soggetti a domanda e offerta, tassi di inflazione, loro rating di credito e quanto sia vicina una determinata obbligazione alla maturità. Come abbiamo discusso, obbligazioni e tassi di interesse hanno una relazione inversa tra di loro: quando il prezzo di uno è alto, il prezzo dell’altro diminuirà. La domanda di obbligazioni dipende quindi dai tassi di interesse e se le obbligazioni rappresentano un investimento attraente perché sono basse o se tassi di interesse più alti tenteranno gli investitori con migliori opportunità. Se i tassi di interesse diventano troppo alti, gli emittenti potrebbero ridurre il numero di obbligazioni in offerta, al fine di ridurre l’offerta in linea con la domanda.
I rating di credito rimangono un forte indicatore del rischio complessivo di un’obbligazione, e le obbligazioni più economiche di solito portano con sé un maggior rischio di inadempienza. Spetta al trader decidere come gestire questo rischio, ma le agenzie di rating rimangono una buona guida su quali obbligazioni rappresentano buoni investimenti.
Man mano che un’obbligazione matura, il suo prezzo tornerà naturalmente al suo valore nominale, poiché il valore dell’obbligazione raggiunge l’importo iniziale del prestito. Il numero di pagamenti cedolari rimanenti su un’obbligazione influenzerà anche il suo prezzo.
Come si negoziano le obbligazioni?
Ora che conosci cos’è e come funzionano le obbligazioni, è il momento di affrontare come negoziarle.
- Scegli il tipo di obbligazioni che vuoi negoziare.
Sia le obbligazioni governative che quelle aziendali sono viste come elementi importanti di un portafoglio diversificato. Qualunque di questi tipi di obbligazione tu scelga di negoziare, un modo popolare per farlo è con i CFD sulle obbligazioni. I CFD sono derivati finanziari che funzionano derivando il loro valore dalla speculazione sul movimento del valore di un’obbligazione, piuttosto che basandosi sul prendere possesso dell’obbligazione stessa.
- Scegli la tua strategia di negoziazione delle obbligazioni.
I CFD sulle obbligazioni, come tutti i CFD, sono strumenti finanziari complessi. Ci sono due approcci generali alle strategie di negoziazione delle obbligazioni che puoi adottare, ma puoi anche fare ulteriori ricerche su altre strategie di trading CFD.
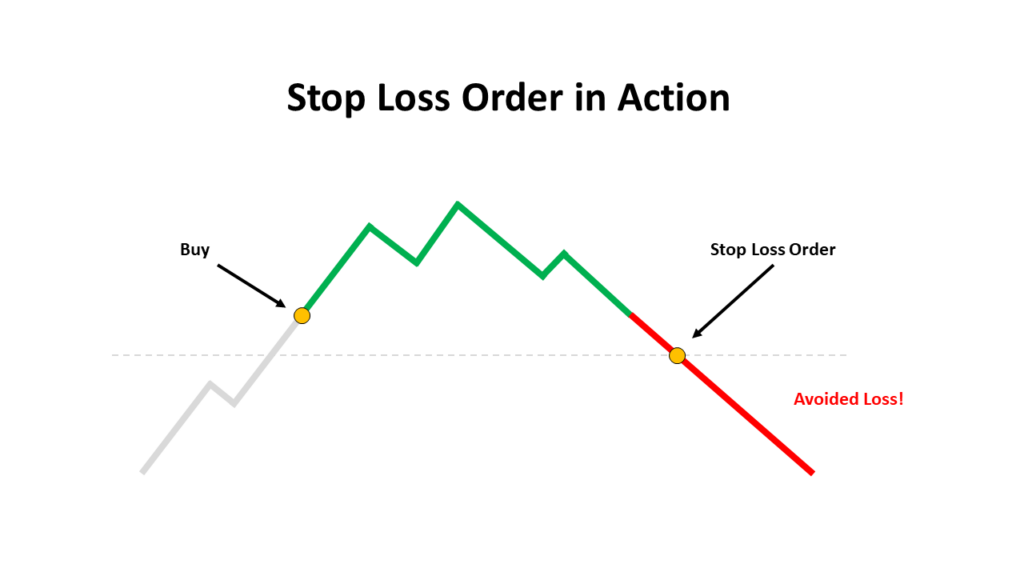
La prima strategia per negoziare i CFD sulle obbligazioni è nota come hedging. Questa è una tattica di mitigazione delle perdite che coinvolge il trading in modo che i tuoi guadagni e le tue perdite si compensino a vicenda.
La seconda strategia è la speculazione sui tassi di interesse. Prevedendo correttamente i movimenti dei tassi di interesse, puoi prendere una posizione sui futures delle obbligazioni governative tramite CFD sulle obbligazioni.
- Apri un conto di trading di obbligazioni.
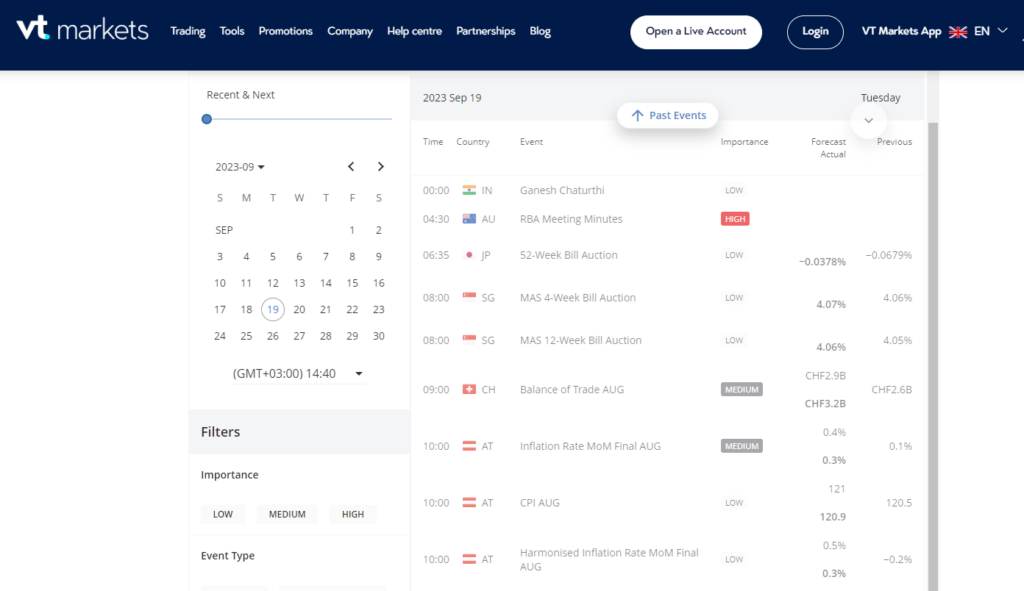
Hai deciso su un CFD sulle obbligazioni e una strategia; ora sei pronto per iniziare a fare trading. Per farlo, dovrai creare un conto di trading live. Su VT Markets, puoi farlo in pochi minuti. Se vuoi praticare la tua strategia prima di entrare nel mercato live, puoi anche creare un conto demo senza rischi per mettere alla prova il tuo approccio.
- Prendi la tua prima posizione.
Infine, ora sei pronto ad aprire e monitorare la tua prima posizione. Assicurati di avere la migliore piattaforma di trading a portata di mano. Su VT Markets, utilizziamo la potente MetaTrader 4 e la sua controparte di nuova generazione, MT5. Cerchi altri consigli e strumenti per il trading? Non esitare a contattare il nostro team oggi.