Que fait un courtier Forex
Un courtier forex agit comme un intermédiaire entre les traders et le système interbancaire, permettant aux individus et aux institutions d’acheter et de vendre des devises étrangères. Les courtiers fournissent des plateformes de trading où les clients peuvent accéder à des données de marché en temps réel, exécuter des transactions et utiliser divers outils d’analyse.
Ils offrent également un effet de levier, permettant aux traders de contrôler des positions plus importantes avec un capital réduit, et gagnent de l’argent grâce aux spreads (la différence entre les prix d’achat et de vente) et aux commissions. De plus, les courtiers forex fournissent des ressources éducatives, un support client et divers types de comptes pour répondre aux différents besoins et stratégies de trading.
Ce qu’il faut considérer lors du choix d’un courtier Forex en France
Lorsque vous choisissez un courtier Forex en France, il est crucial de considérer plusieurs facteurs pour garantir une expérience de trading sécurisée et efficace. Voici les principaux éléments à prendre en compte :
1. Frais de Trading
Les frais de trading peuvent varier considérablement d’un courtier à l’autre. Vérifiez les spreads (différence entre le prix d’achat et de vente) et les commissions appliquées par le courtier. Certains courtiers offrent des spreads plus serrés mais facturent des commissions, tandis que d’autres offrent des spreads légèrement plus larges sans commissions. Il est important de comprendre ces coûts pour évaluer leur impact sur vos profits.
2. Plateformes de Trading
Une bonne plateforme de trading est essentielle pour une expérience de trading fluide. Recherchez des courtiers qui offrent des plateformes réputées comme MetaTrader 4 (MT4) ou MetaTrader 5 (MT5), connues pour leurs outils d’analyse technique avancés et leur facilité d’utilisation. Assurez-vous également que le courtier propose une version mobile de la plateforme pour trader en déplacement.
3. Variété des Instruments Financiers
La diversité des instruments financiers disponibles est un autre facteur clé. En plus des paires de devises, certains courtiers offrent des CFD sur indices, matières premières, actions et cryptomonnaies. Avoir accès à une large gamme de produits vous permet de diversifier votre portefeuille et de profiter de différentes opportunités de trading.
4. Service Client
Un service client réactif et compétent est indispensable. Vérifiez les options de support disponibles (chat en direct, téléphone, email) et les heures d’ouverture du service client. Un bon courtier doit être en mesure de vous assister rapidement en cas de problème ou de question.
5. Outils de Formation et Ressources
Pour les traders débutants, il est important de choisir un courtier qui offre des ressources éducatives de qualité. Recherchez des webinaires, des vidéos explicatives, des articles et des comptes de démonstration qui vous permettent de vous former et de vous entraîner sans risque.
6. Promotions et Bonus
Certains courtiers offrent des bonus de dépôt ou des promotions pour attirer de nouveaux clients. Bien que cela puisse être attractif, il est important de lire les conditions associées à ces offres pour s’assurer qu’elles sont vraiment avantageuses.
7. Avis sur les Courtiers Forex
Les avis sur les courtiers Forex jouent un rôle crucial pour les traders en leur fournissant des informations précieuses sur les différentes plateformes disponibles. Ces critiques offrent un aperçu de la fiabilité, de la transparence et de l’efficacité des courtiers, en examinant des aspects tels que les spreads, les commissions, les méthodes de dépôt et de retrait, ainsi que la qualité du service client.
Les avis peuvent également inclure des témoignages d’utilisateurs réels, des comparaisons avec d’autres courtiers et des évaluations basées sur des critères spécifiques comme la sécurité et la régulation. En consultant ces avis, les traders peuvent prendre des décisions éclairées et choisir le courtier qui correspond le mieux à leurs besoins et à leurs objectifs de trading.
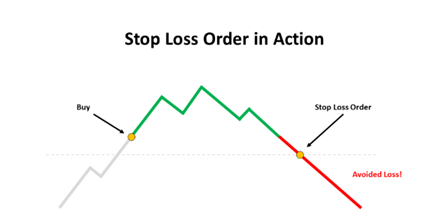
Risques liés au trading forex
Le trading forex présente plusieurs risques importants. La volatilité des marchés peut entraîner des fluctuations rapides des taux de change, entraînant des pertes significatives. L’utilisation de l’effet de levier amplifie les gains potentiels, mais augmente également les pertes.
Le risque de contrepartie, où la partie opposée à une transaction ne respecte pas ses obligations, et le risque de liquidité, surtout avec des paires de devises moins courantes, sont également des préoccupations majeures. Une gestion inadéquate des risques peut entraîner des pertes substantielles, soulignant l’importance d’une approche rigoureuse et bien informée.
Pourquoi Vous Devriez Considérer VT Markets pour le Trading Forex
VT Markets se distingue par sa transparence, sa fiabilité et ses outils de trading avancés, ce qui en fait un choix judicieux pour le trading Forex. En proposant les plateformes MetaTrader 4 (MT4) et MetaTrader 5 (MT5), VT Markets offre aux traders des outils d’analyse technique de pointe et des fonctionnalités de trading automatisé, favorisant ainsi une expérience de trading fluide et efficace.
De plus, VT Markets est réglementé par des autorités financières réputées, garantissant un environnement de trading sécurisé et conforme. Enfin, avec des spreads compétitifs et un service client réactif, VT Markets répond aux besoins des traders de tous niveaux, assurant une assistance rapide et efficace en cas de problème.
Ce qu’il faut rechercher chez le meilleur courtier Forex en France
En conclusion, choisir le bon courtier Forex est crucial pour garantir une expérience de trading sécurisée et efficace. VT Markets se distingue comme une option idéale grâce à sa transparence, sa fiabilité et ses outils de trading avancés. Avec des plateformes de pointe comme MetaTrader 4 et MetaTrader 5, une large gamme d’instruments financiers, des frais de trading compétitifs, et un service client réactif, VT Markets répond aux besoins des traders de tous niveaux.
De plus, les ressources éducatives et les promotions attractives renforcent encore l’attrait de VT Markets. En optant pour VT Markets, vous bénéficiez d’un environnement de trading sécurisé, réglementé par des autorités financières réputées, et d’une assistance continue pour maximiser vos opportunités de succès sur le marché Forex.
Commencez votre compte Forex en direct avec VT Markets dès maintenant!