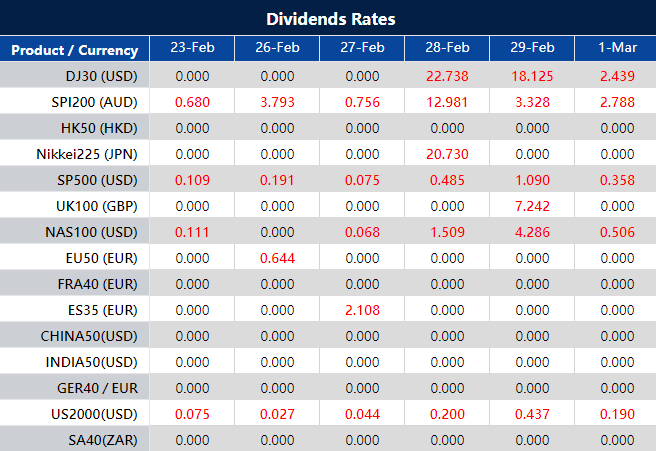
Please note that the dividends of the following products will be adjusted accordingly. Index dividends will be executed separately through a balance statement directly to your trading account, and the comment will be in the following format “Div & Product Name & Net Volume ”.
Please refer to the table below for more details:
The above data is for reference only, please refer to the MT4/MT5 software for specific data.
If you’d like more information, please don’t hesitate to contact info@vtmarkets.com.
Written on February 23, 2024 at 8:36 am, by anakin
ETFs, or Exchange-Traded Funds, are gaining popularity among investors for their simplicity and versatility. They provide an easy way to invest in a range of assets, making them accessible for non-professional traders.
Imagine being able to invest in a diverse basket of stocks or bonds without the complexity of managing individual assets—that’s the power of ETFs.
In this article, we’ll explore why ETFs matter for forex traders, covering their basics, advantages, popular categories, and practical trading tips.
Understanding ETFs
ETFs are investment funds traded on stock exchanges, similar to individual stocks. However, they’re different from mutual funds and individual stocks in a couple of ways.
Firstly, ETFs are like mutual funds because they pool investors’ money to invest in various assets like stocks, bonds, or commodities. But, unlike mutual funds traded at the end of the day, ETFs are traded on stock exchanges throughout the day at market prices, just like stocks.
Secondly, ETFs differ from individual stocks because they represent ownership in a mix of assets, not just one company. So, when you invest in an ETF, you’re actually buying a share of a fund holding a bunch of different securities.
ETFs track specific benchmarks like the S&P 500 for stocks or the Barclays Capital Aggregate Bond Index for bonds, aiming to mirror their performance by holding similar assets.
For forex traders, ETFs offer diversification by investing in a variety of securities within one investment. This spreads risk, ideal for those with limited capital or seeking a diverse portfolio without buying multiple securities.
ETFs provide liquidity since they trade on stock exchanges throughout the day at market prices. This allows easy buying and selling, unlike mutual funds which trade once a day.
Furthermore, ETFs offer transparency by disclosing their holdings daily, giving investors clear visibility into their investments.
Popular ETF categories
ETFs come in various categories, each offering unique investment opportunities for forex traders. Here is a breakdown of the most common types:
1. Equity ETFs
These ETFs invest in stocks, providing exposure to a particular market, industry, or region. They offer diversification across multiple companies within a single investment.
For example, the SPDR S&P 500 ETF (SPY) tracks the performance of the S&P 500 Index, offering broad exposure to large-cap US stocks.
2. Bond ETFs
Bond ETFs invest in fixed-income securities such as government bonds, corporate bonds, or municipal bonds. They offer income generation and diversification, with varying levels of risk depending on the underlying bonds.
An example is the iShares Core US Aggregate Bond ETF (AGG), which tracks the performance of the US investment-grade bond market.
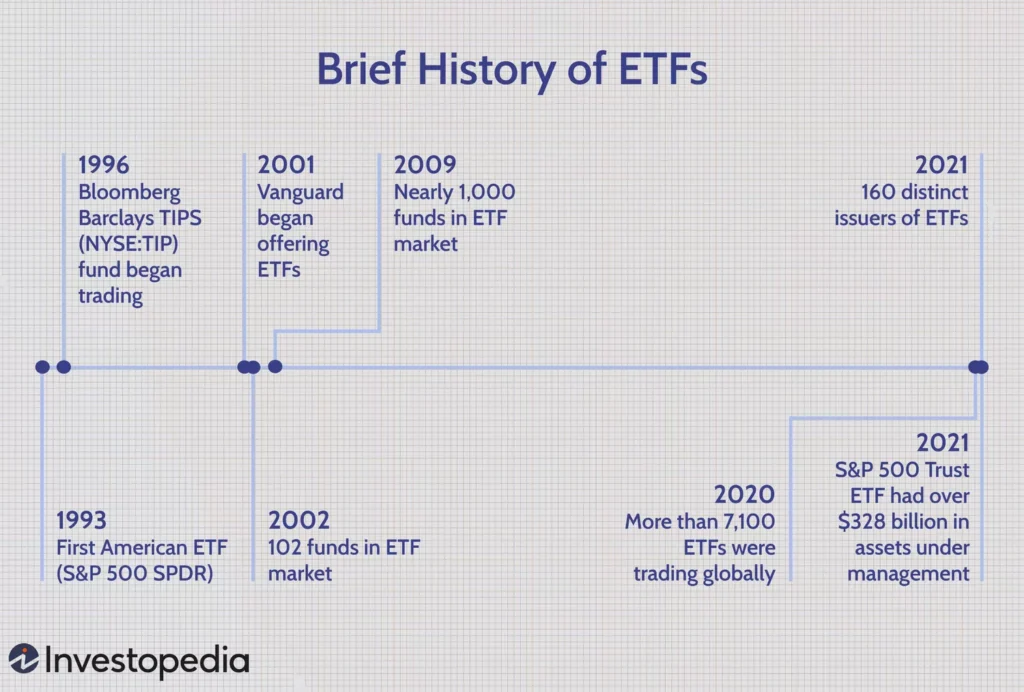
Brief history of ETFs source: Investopedia
3. Commodity ETFs
These ETFs track the performance of commodities like gold, silver, oil, or agricultural products. They provide exposure to commodity prices without the need for direct commodity ownership.
The SPDR Gold Shares ETF (GLD) is a popular example, offering exposure to the price of gold.
4. Sector ETFs
Sector ETFs focus on specific sectors or industries, such as technology, healthcare, or energy. They allow investors to target areas of the market they believe will outperform or diversify their portfolio.
For instance, the Technology Select Sector SPDR Fund (XLK) invests in technology companies within the S&P 500 Index.
Each category of ETFs has its own characteristics and potential benefits, catering to different investment objectives and risk tolerances.
Advantages of trading ETF CFDs
Trading ETFs through CFDs (Contracts for Difference) involves entering into a contract with a broker to speculate on the price movement of the ETF without owning the underlying asset.
When it comes to ETF CFDs trading, there are several advantages worth considering:
Flexibility and leverage: CFDs offer traders the flexibility to control larger positions with a smaller amount of capital, potentially amplifying gains or losses compared to traditional investing.
Long and short positions: CFD trading allows traders to take both long (buy) and short (sell) positions on ETFs, enabling them to profit from both rising and falling markets.
In summary, trading ETFs through CFDs provides forex traders with flexibility, leverage, and the opportunity to profit from both upward and downward price movements in the market.
Tips for successful ETF trading
By following these tips, you can enhance your chances of success in ETF trading while managing risks effectively:
Have a well-defined trading plan: It’s crucial to establish a clear trading plan outlining your goals, risk tolerance, and strategies. Stick to your plan and avoid making impulsive decisions based on emotions or market fluctuations.
Stay informed about market trends: Keep yourself updated on market trends and news that could affect ETF prices. This includes economic indicators, geopolitical events, and industry-specific developments. Being informed allows you to make informed decisions and adapt your trading strategy accordingly.
Diversify your investments: Spread your risk by diversifying across multiple ETFs representing different sectors or asset classes. This helps mitigate the impact of volatility in any single investment and allows you to capture opportunities in various market segments.
In conclusion, ETFs serve as versatile investment vehicles for forex traders, offering exposure to various asset classes like stocks, bonds, and commodities. Trading ETFs through CFDs provides flexibility, leverage, and profit opportunities. It’s essential to have a well-defined trading plan, stay informed about market trends, and practice responsible trading strategies. By implementing these principles, traders can navigate the market confidently and responsibly, maximising their potential for success.
Written on February 22, 2024 at 1:54 pm, by anakin
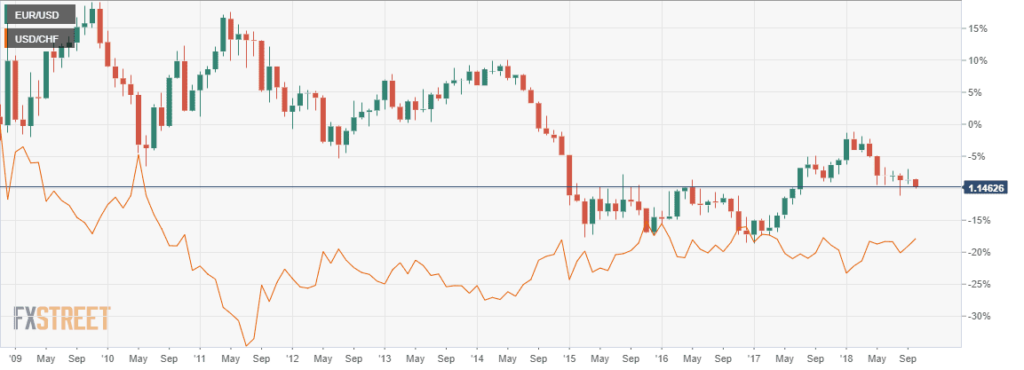
In forex trading, correlations show how different currency pairs or financial instruments move together. For example, when the EUR/USD pair goes up, the USD/CHF pair often goes down, and vice versa.
source: investopedia
Understanding these relationships is crucial. It helps traders predict market movements, manage risks, and make smarter decisions. In this guide, we will explore correlations in forex trading and how you can use them to improve your strategies. Let’s get started!
Understanding correlations
Correlation in forex refers to the statistical relationship between different currency pairs or financial instruments and how they move in relation to each other.
It is measured on a scale from -1 to +1, where -1 indicates a perfect negative correlation (inverse movement), +1 indicates a perfect positive correlation (same direction movement), and 0 indicates no correlation (movements are independent of each other).
Correlation types source: Simply Psychology
Understanding correlation helps traders anticipate how one asset’s movement may affect another.
Positive correlation: This occurs when two currency pairs or assets tend to move in the same direction. For example, if the EUR/USD pair goes up, the GBP/USD pair also tends to rise. Traders can use positive correlations to diversify their portfolios by trading multiple currency pairs that move in tandem, potentially reducing overall risk exposure.
Negative correlation: In contrast, negative correlation occurs when two currency pairs or assets move in opposite directions. For instance, when the USD/JPY pair increases, the price of Gold may decrease. Traders can use negative correlations as a hedging strategy to offset potential losses in one position with gains in another, helping to mitigate risk during market fluctuations.
Neutral correlation: Neutral correlation indicates a weak or non-existent relationship between currency pairs or assets. For example, the EUR/USD and USD/CHF pairs may show little correlation, meaning their movements do not significantly influence each other. While neutral correlations may not offer direct trading opportunities, they can still provide valuable information about market dynamics and help traders avoid making decisions based on false assumptions of correlation.
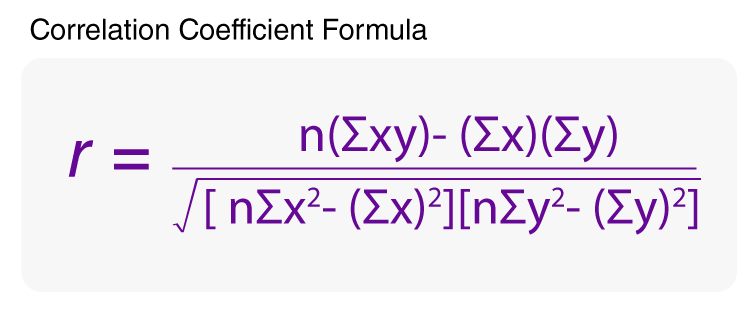
The correlation coefficient formula may seem complex, but you can use a specialised online calculator. source: BYJU’S
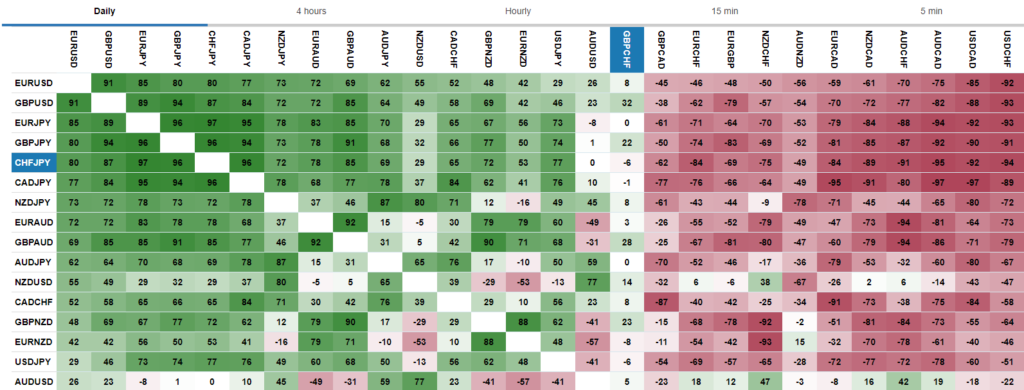
How to identify correlations
If you’ve decided to count the correlation between two currency pairs, here’s a guide to help you get started:
1. Select currency pairs: Choose the currency pairs you want to analyse for correlation. For example, you might want to examine the correlation between EUR/USD and GBP/USD.
2. Collect historical data: Gather historical price data for the selected currency pairs. You can obtain this data from various sources such as trading platforms, financial websites, or specialised data providers.
3. Calculate correlation coefficient: Use online correlation calculators, Excel spreadsheets with built-in functions like CORREL, or trading platforms such as MetaTrader 4 (MT4) and MetaTrader 5 (MT5) to compute correlation coefficients between the currency pairs.
4. Interpret results: Analyse the correlation coefficient to understand the relationship between the currency pairs. A coefficient close to +1 indicates a strong positive correlation, while a coefficient close to -1 indicates a strong negative correlation. A coefficient close to 0 suggests a weak or no correlation.
5. Repeat for different timeframes: Consider calculating correlations over different timeframes (e.g., daily, weekly, monthly) to identify any changes in correlation patterns over time. This can provide valuable insights into the stability of the correlation relationship.
By following these steps, you can effectively count and interpret the correlation between currency pairs, helping you make more informed trading decisions in the forex market.
Various factors influence the correlations between currency pairs in forex trading. Understanding these nuances is crucial for traders seeking to anticipate market movements and make informed trading decisions.
Economic indicators: Gross Domestic Product (GDP), growth rates, and inflation significantly shape currency correlations. Positive GDP figures in both the Eurozone and the US can strengthen the correlation between EUR/USD and USD/CHF pairs. Divergent inflation rates can weaken correlations as traders adjust their strategies based on economic forecasts.
Market sentiment: Reflecting traders’ attitudes towards currencies, market sentiment impacts correlations. During periods of increased risk appetite, currencies like the Australian dollar (AUD) and New Zealand dollar (NZD) tend to exhibit positive correlations. Safe-haven currencies such as the US dollar (USD) and Japanese yen (JPY) may strengthen during times of uncertainty, thereby weakening correlations with riskier currencies.
Geopolitical events: Events such as elections or trade negotiations can disrupt currency correlations. Major agreements may strengthen correlations between currencies, while heightened tensions can weaken them as traders seek refuge in safer assets. Increased geopolitical risks might diminish the correlation between USD/JPY and gold.
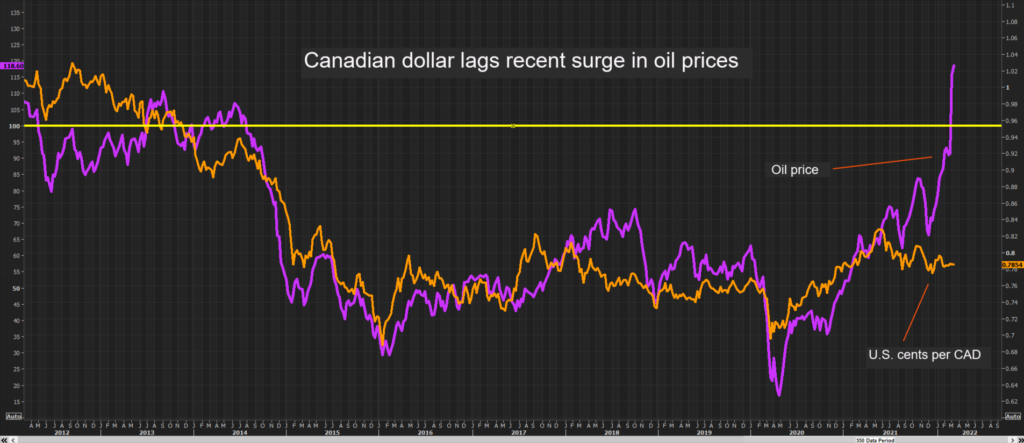
The relationship between currencies and commodities: The interplay between currencies and commodities also influences currency correlations. For example, the Canadian dollar (CAD) often correlates positively with oil prices due to Canada’s significant oil exports. Consequently, a rise in oil prices could strengthen the correlation between USD/CAD and oil. Conversely, if gold prices surge, the correlation between USD/JPY and gold may weaken, given the status of the Japanese yen as a safe-haven currency.
USD/CAD and oil prices positive correlation source: Reuters
Using correlations in trading
Leveraging correlations in forex trading provides traders with a strategic advantage, offering insights into market dynamics and aiding in risk management. By incorporating correlations into trading strategies, traders refine their approach, optimise trade timing, and enhance overall performance in the forex market.
Strategy development: Design strategies to capitalise on currency correlations, identifying trends, and optimising trade timing.
Risk management: Utilise correlated pairs for hedging to mitigate losses and minimise risk exposure. Additionally, diversify risk across multiple currency pairs or asset classes to reduce volatility and enhance stability.
Portfolio diversification: Spread investments across various currency pairs or asset classes with low or negative correlations to minimise overall portfolio risk and enhance long-term stability.
Identifying opportunities: Utilise correlations to identify diversification opportunities by selecting currency pairs with low or negative correlations.
Asset class monitoring: Monitor correlations between different asset classes to optimise portfolio allocation and achieve risk-adjusted returns.
In conclusion, knowing how currency pairs interact is vital for smart decision-making and managing risks in forex trading. Using correlation analysis is strongly recommended as it helps traders choose the best times to trade, manage risks effectively, and get the most out of their investments.
Written on February 22, 2024 at 1:06 pm, by anakin
As part of our commitment to provide the most reliable service to our clients, there will be server maintenance this weekend.
Maintenance Hours :
24th of February 2024 (Saturday) 02:00 – 10:00 (GMT+2)
Please note that the following aspects might be affected during the maintenance:
1. The price quote and trading management will be temporarily disabled during the maintenance. You will not be able to open new positions, close open positions, or make any adjustments to the trades.
2. There might be a gap between the original price and the price after maintenance. The gaps between Pending Orders, Stop Loss and Take Profit will be filled at the market price once the maintenance is completed. If you don’t want to hold any open positions during the maintenance, it is suggested to close the position in advance.
3. Please refer to MT4/MT5 for the latest update on the completion and market opening time. Our services will be back online once the maintenance is completed.
Thank you for your patience and understanding about this important initiative.
If you’d like more information, please don’t hesitate to contact info@vtmarkets.com
Written on February 22, 2024 at 9:18 am, by anakin
Top of FormThe U.S. dollar pared some losses following the Federal Reserve’s minutes, which advised caution against early rate cuts.
Despite an uptick in U.S. Treasury yields, the dollar experienced minor losses after the Jan. 30-31 FOMC minutes were released.
The Fed requires more proof of disinflation before considering easing policy, indicating a delay in the rate cut cycle possibly to the latter half of the year.
A postponement in rate adjustments may lift U.S. bond yields and the dollar, potentially bringing the DXY index to new highs.
This situation could hinder gains for EUR/USD and GBP/USD, while USD/JPY and USD/CAD might face fewer obstacles in rising.
STOCK MARKET:
Nvidia’s Sales Forecast Impact: Nvidia’s strong sales forecast has led to a surge in global stock markets, highlighting the growing investor confidence in generative AI.
Record Highs in Japan: The Nikkei 225 index in Japan reached a record peak, a height not seen since 1989, fueled by technology and semiconductor gains.
European Market Reaction: Following Nvidia’s announcement, Europe’s Stoxx 50 futures saw an increase of nearly 0.9%, indicating positive market sentiment across regions.
Revenue Expectations Exceeded: Nvidia’s anticipated first-quarter revenue of $24 billion surpasses previous estimates, signaling robust growth in the tech sector.
Asian Markets Rally: Stocks in South Korea, Taiwan, and China rose, with the Asian shares index reaching its highest level in almost two years, demonstrating regional market strength.
Tech Company Performance: Nvidia’s post-market share increase of up to 11% reflects the high expectations and performance of tech companies, especially in AI.
China’s Market Stabilization: The Chinese government’s interventions to stabilize its stock market have resulted in prolonged gains, showcasing effective regulatory measures.
Global Economic Implications: The rally in global equities, driven by Nvidia’s forecast, underscores the pivotal role of technology and AI in shaping economic landscapes.
Currency and Commodity Movements: The article notes shifts in currency values, with the dollar slipping, and increases in commodity prices such as crude oil and gold.
Anticipated Economic Data Releases: Markets are also responding to expectations for upcoming economic data from the Eurozone and the U.S., which could further influence global financial trends.
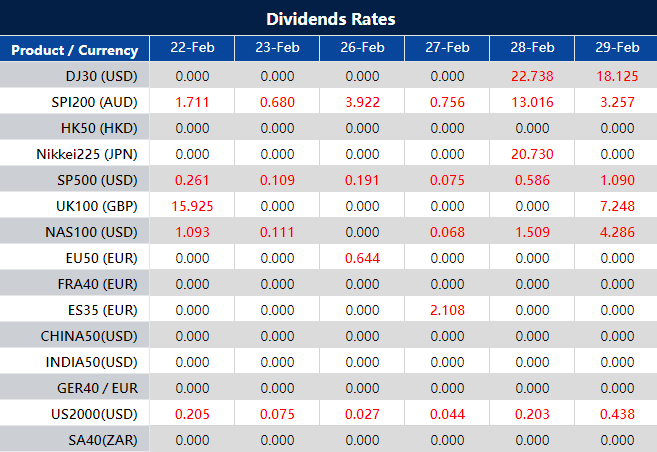
Please note that the dividends of the following products will be adjusted accordingly. Index dividends will be executed separately through a balance statement directly to your trading account, and the comment will be in the following format “Div & Product Name & Net Volume ”.
Please refer to the table below for more details:
The above data is for reference only, please refer to the MT4/MT5 software for specific data.
If you’d like more information, please don’t hesitate to contact info@vtmarkets.com.
Written on February 22, 2024 at 7:38 am, by anakin
Please note that the dividends of the following products will be adjusted accordingly. Index dividends will be executed separately through a balance statement directly to your trading account, and the comment will be in the following format “Div & Product Name & Net Volume ”.
Please refer to the table below for more details:
The above data is for reference only, please refer to the MT4/MT5 software for specific data.
If you’d like more information, please don’t hesitate to contact info@vtmarkets.com.
Written on February 22, 2024 at 7:13 am, by anakin
Top of Form U.S. Dollar Performance Pre-Fed Minutes: The U.S. dollar experienced a slight decline due to subdued U.S. yields, with a lack of significant market drivers on Tuesday.
Anticipation for FOMC Minutes Release: Market volatility is expected to increase with the upcoming release of the FOMC minutes, which could shed light on the Fed’s inflation outlook and potential timing for rate cuts.
Fed’s Stance on Rate Cuts: Recent statements by Fed officials suggest a cautious approach to immediate rate cuts, which could lead to higher U.S. Treasury yields and strengthen the dollar.
Potential Market Reactions: If the FOMC minutes indicate a possibility of earlier easing, it may result in lower yields and a weaker dollar, whereas a confirmation of a delayed easing cycle could bolster the dollar.
Technical Analysis for USD Currency Pairs: The article will focus on the technical analysis of major USD pairs, including EUR/USD, GBP/USD, and USD/JPY, highlighting key price levels for traders.
STOCK MARKET:
Nvidia’s Q4 earnings are viewed as a crucial test for the AI sector, with expectations for a 234% surge in revenue.
The company’s stock has seen a remarkable 184% increase over the past year, outperforming rivals like AMD and Intel.
Despite a brief moment as the third-most valuable company globally, Nvidia was surpassed by Amazon and Alphabet as of the latest update.
For Q4, projections are set for Nvidia to report earnings of $4.60 per share on $20.4 billion in revenue, a significant jump from the previous year.
The Data Center segment, fueled by demand for AI, is anticipated to report $17.2 billion in revenue, a dramatic increase from the year before.
Meta plans to incorporate 350,000 Nvidia H100 chips into its AI data centers by end of 2024, indicating substantial revenue for Nvidia.
Gaming revenue is also expected to rise, from $1.8 billion to $2.7 billion.
Forward guidance from Nvidia will be closely watched for indications of sustained AI market strength.
Analysts have raised their price targets for Nvidia, reflecting optimistic expectations.
Nvidia faces competition from AMD and Intel in AI chips and challenges from companies developing their own AI chips, including Amazon and Google.
Nvidia is addressing the threat of customized AI chips by discussing potential collaborations with major tech firms.
U.S. export restrictions to China pose a challenge for Nvidia, but the company does not anticipate an immediate financial impact.