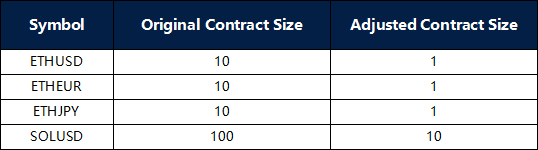
Shares product SPCE is about to conduct a reverse share split after the market closes on June 14, 2024. Starting from the market opening on June 17, 2024, SPCE expects to provide investor trading in divided contracts.
After the share split, please be aware of the following:
1. The trading volume of SPCE open positions will become 1/20 of the original lot size.
2. The “opening price” and “take-profit/stop-loss setting price” of SPCE’s positions will become 20 times the original price.
3. SPCE’s price at the opening of the market on June 17 is expected to be approximately 20 times the closing price on June 14.
4. After the market closes on June 14, all SPCE pending orders in real accounts will be cancelled.
5. After the market closes on June 14, all SPCE orders in the demo account will be cancelled, including open positions and pending orders.
The above data is for reference only, please refer to the MT4/MT5 software for specific data.
If you’d like more information, please don’t hesitate to contact info@vtmarkets.com.
As part of our commitment to provide the most reliable service to our clients, there will be server maintenance and VT APP this weekend.
MT4/MT5 Trading Hours: June 15th 2024 (Saturday) postponed to open at 11:00
VT Markets APP Maintenance: June 15th 2024 at 04.00 am (Saturday) – June 16th 2024 at 13.00 pm (Sunday) The above time is system time GMT+3.
Please note that the following aspects might be affected during the maintenance:
1. During the maintenance period, VT Markets App will not be able to log in. If you need to apply for deposits and withdrawals or other account-related applications, it is recommended that you operate through the client portal.
2. Before the trading hours, the price quote and trading management will be temporarily disabled. You will not be able to open new positions, close open positions, or make any adjustments to the trades.
3. There might be a price gap after the trading hours opening. The Pending Orders, Stop Loss and Take Profit will be filled at the market price after trading hours opening.
Please refer to the MT4 / MT5 / VT APP software for the specific maintenance completion and marketing opening time.
Thank you for your patience and understanding about this important initiative.
If you’d like more information, please don’t hesitate to contact info@vtmarkets.com.
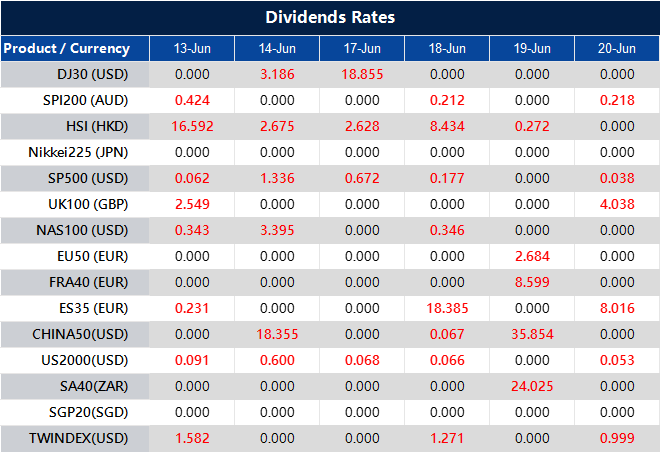
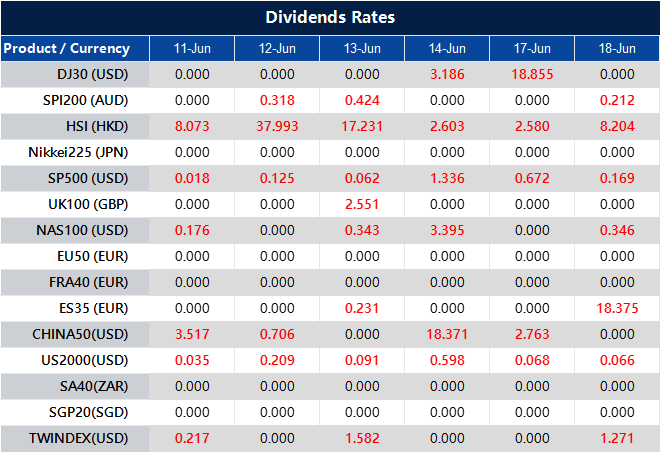
Please note that the dividends of the following products will be adjusted accordingly. Index dividends will be executed separately through a balance statement directly to your trading account, and the comment will be in the following format “Div & Product Name & Net Volume ”.
Please refer to the table below for more details:
The above data is for reference only, please refer to the MT4/MT5 software for specific data.
If you’d like more information, please don’t hesitate to contact info@vtmarkets.com.
As we navigate the ever-changing investment landscape, it’s crucial for investors to stay ahead of the curve and adapt to emerging trends. The year 2024 promises to be an exciting time, with new opportunities and challenges on the horizon. In this article, we’ll explore some of the top investing trends that are shaping the future of finance and guiding investment decisions.
Trend 1: Sustainable and impact investing
Environmental, social, and governance (ESG) factors have become increasingly important in investment decisions, and this trend is set to continue in 2024. Investors are recognising the long-term value of companies that prioritise sustainability and ethical practices.
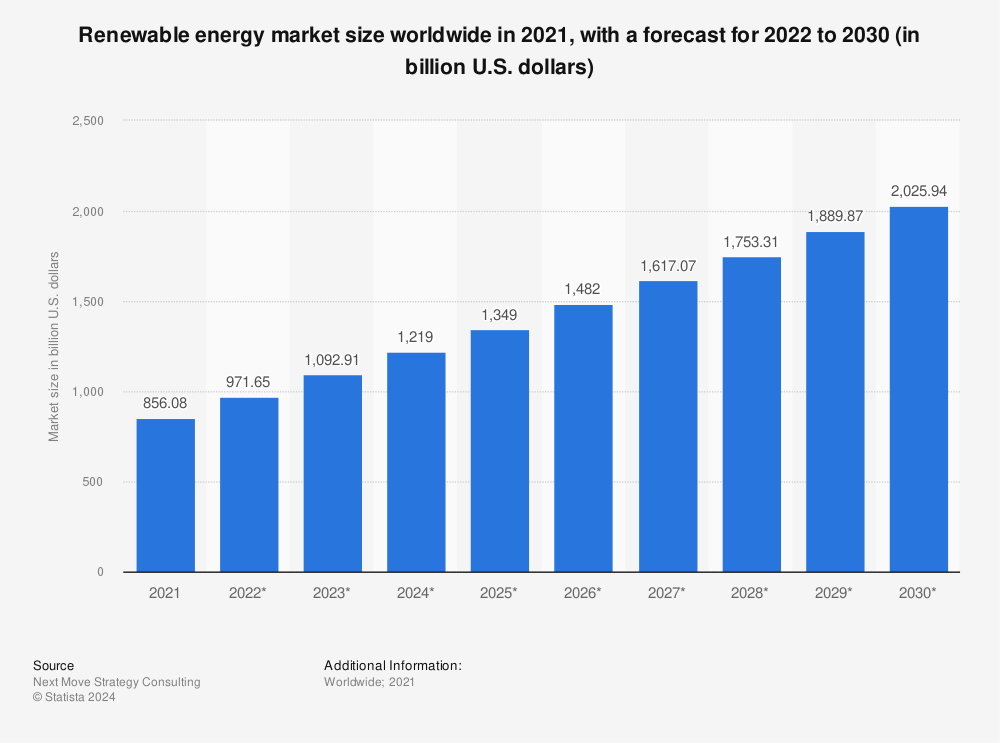
Companies and industries that are leading the way in sustainable practices, such as renewable energy, sustainable agriculture, and circular economy initiatives, are attracting significant investor interest.
Investors are flocking to sustainable companies like NextEra Energy, a renewable energy giant, Apeel Sciences, which develops innovative coatings to reduce food waste, and Tomra Systems, a leader in advanced recycling solutions, as they recognise the long-term growth potential and competitive advantage of embracing environmentally and socially responsible practices.
These organisations not only contribute to a better planet but also position themselves for long-term growth and competitive advantage in an increasingly eco-conscious market.
One area of particular focus within sustainable investing is the green energy and clean technology sectors. As concerns over climate change and fossil fuel depletion continue to mount, investments in renewable energy sources are expected to surge. The renewable energy market is projected to reach $1.9 trillion by 2030, with an annual growth rate of 8.6% from 2022 to 2030.
Trend 2: Artificial intelligence (AI) and automation
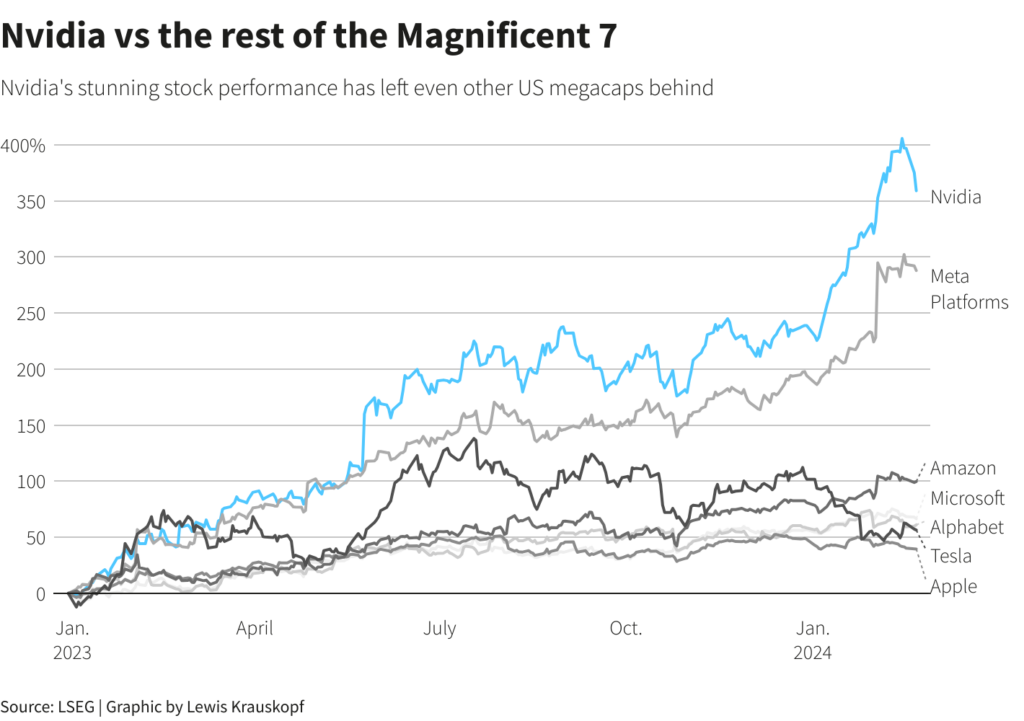
The rapid advancements in artificial intelligence (AI) and automation technologies are transforming industries across the board, creating new investment opportunities.
The global AI market is expected to grow from $58.3 billion in 2021 to $309.6 billion by 2026, at a compound annual growth rate of 39.7%.
Companies that are at the forefront of developing cutting-edge AI and automation solutions, such as Google (GOOG), Microsoft (MSFT), and NVIDIA (NVDA), as well as those successfully integrating these technologies into their operations like Amazon (AMZN) and UPS (UPS), are likely to see significant growth and investor interest.
Sectors such as healthcare, finance, and manufacturing are poised to benefit greatly from AI and automation. For instance, the AI in healthcare market is projected to reach $120.2 billion by 2028, growing at the compound annual growth rate (CAGR) of 48.7% from 2021 to 2028.
However, it’s essential to address the potential risks and challenges associated with these technologies, such as job displacement and ethical considerations.
Trend 3: Cryptocurrency and blockchain
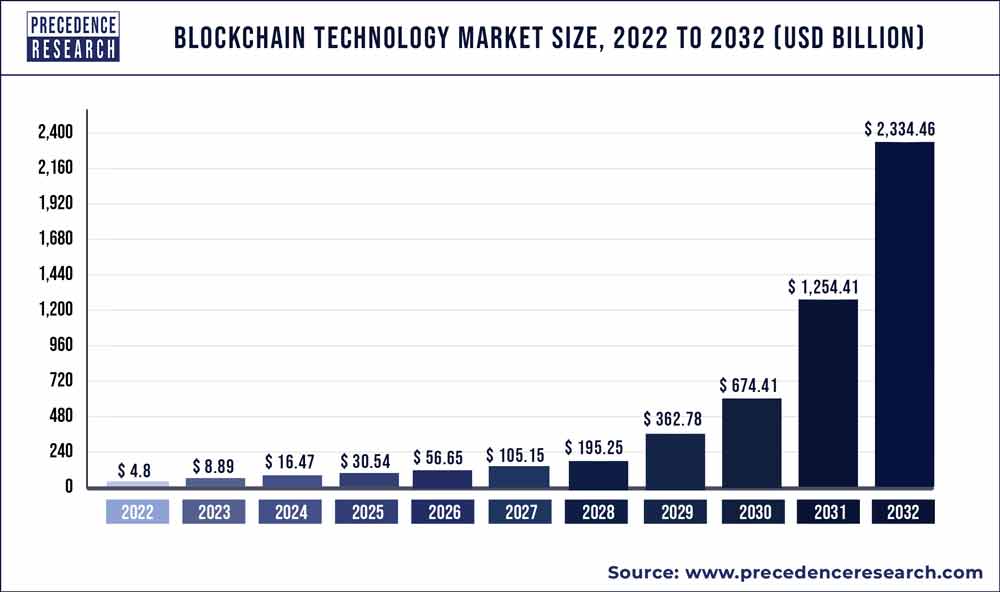
The cryptocurrency and blockchain space has gained mainstream attention, and its influence is expected to continue growing in 2024.
Investors are increasingly exploring opportunities in cryptocurrencies, blockchain-based projects, and companies developing blockchain solutions for various industries. The global blockchain market size is expected to grow from $4.9 billion in 2021 to $227.3 billion by 2028, at a CAGR of 68.4%.
While the regulatory landscape surrounding cryptocurrencies and blockchain remains evolving, the potential for disruptive innovation in areas like finance, supply chain management, and data security cannot be overlooked.
However, investors should exercise caution and conduct thorough due diligence, as this space is still highly volatile and carries significant risks.
Trend 4: Alternative investments
As investors seek diversification and higher returns, alternative investments, such as real estate, private equity, and hedge funds, are becoming increasingly popular.
These investments offer the potential for higher returns but also come with higher risks, illiquidity, and complexity. The global alternative investment market is expected to reach $24.5 trillion by 2026, growing at a CAGR of 12.3% from 2021 to 2026.
Within the realm of alternative investments, areas like farmland, timberland, and dividend-paying stocks are gaining traction as investors seek consistent income streams and diversification from traditional asset classes. For instance, the global dividends paid out by listed companies reached a record $1.47 trillion in 2022.
However, it’s crucial to thoroughly understand the risks and conduct rigorous due diligence before investing in alternative investments.
Trend 5: Thematic investing
Thematic investing, where investors target specific themes or megatrends rather than traditional sectors or asset classes, is an emerging trend in 2024.
This approach allows investors to capitalise on long-term growth opportunities by focusing on themes such as healthcare innovation, cybersecurity, e-commerce, and clean energy. Data by Morningstar, a US financial services firm, show the total amount invested in thematic funds grew to $718bn in the fourth quarter of 2021, from $251bn two years earlier.
Thematic investing offers the potential for diversification across multiple sectors and the ability to participate in disruptive technologies and paradigm shifts. Popular investment themes and funds focused on these themes are expected to attract significant investor interest in the coming year.
Conclusion
As we navigate the investment landscape of 2024, it’s essential to stay informed and adapt to emerging trends. The trends discussed in this article – sustainable and impact investing, AI and automation, cryptocurrency and blockchain, alternative investments, and thematic investing – present both opportunities and challenges for investors.
While embracing these trends can lead to potentially lucrative returns, it’s crucial to conduct thorough research, seek professional advice, and make informed investment decisions based on individual goals and risk tolerance.
Additionally, diversification strategies, such as investing in different geographic regions or asset classes, will remain crucial for mitigating risk and enhancing overall portfolio performance. Stay proactive, stay informed, and stay ahead of the curve – these are the keys to successful investing in the dynamic and ever-changing world of finance.
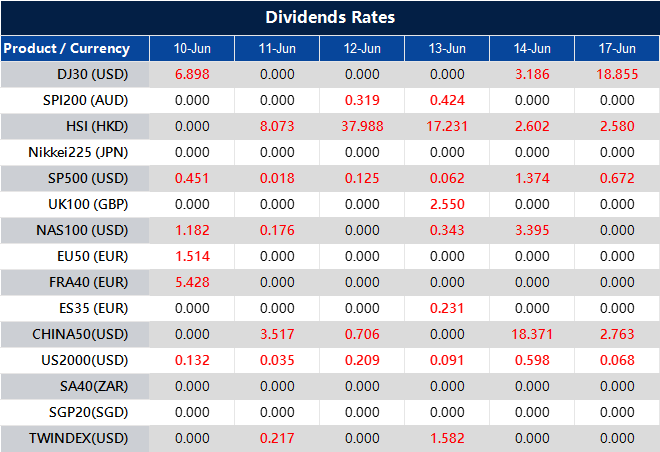
Please note that the dividends of the following products will be adjusted accordingly. Index dividends will be executed separately through a balance statement directly to your trading account, and the comment will be in the following format “Div & Product Name & Net Volume ”.
Please refer to the table below for more details:
The above data is for reference only, please refer to the MT4/MT5 software for specific data.
If you’d like more information, please don’t hesitate to contact info@vtmarkets.com.
The forex market is no child’s play. It requires a keen understanding of the different types of currency pairs: major, minor, and exotic. Each category behaves differently based on various economic factors and market dynamics, making this knowledge crucial for both novice and experienced traders.
This article delves into these categories, highlighting their unique characteristics and providing tips to align them with your trading style. Ready to explore the world of currency trading? Let’s dive in.
What are Major, Minor, and Exotic currency pairs?
In Forex trading, currencies are quoted in pairs, reflecting the value of one currency against another. The ‘majors’ comprise the world’s most heavily traded currencies paired with the USD, such as EUR/USD, USD/JPY, GBP/USD, and USD/CHF. These pairs are well known for their liquidity and narrow spreads, making them the linchpins of the market.
Minor pairs, or ‘crosses,’ do not feature the USD but involve other significant currencies. Examples like EUR/GBP, GBP/JPY, and EUR/AUD are popular among traders looking to diversify their strategies beyond the dollar-centric majors.
On the other hand, exotic pairs include a major currency and the currency of a developing economy, such as USD/SGD (Singapore dollar), USD/HKD (Hong Kong dollar), and USD/TRY (Turkish lira). These pairs are less liquid, more volatile, and have wider spreads, presenting both higher risks and potential rewards.
Characteristics of Major currency pairs
Major currency pairs, often referred to as the “majors,” are the most traded pairs in the Forex market and are known for several distinctive attributes that appeal to both novice and seasoned traders. They include:
Stability and predictability
The majors are characterized by their stability. This stability is primarily due to the large volume of trades executed daily, which typically exceeds billions of dollars for pairs like EUR/USD or USD/JPY.
This high volume ensures that price movements are smoother compared to less frequently traded pairs. For example, the EUR/USD, which pairs the euro with the US dollar, tends to have less abrupt volatility because both currencies are backed by large, stable economies.
Liquidity
Liquidity refers to the ability to buy or sell an asset without causing significant price changes. Major pairs have high liquidity, meaning that there are always buyers and sellers available.
This liquidity benefits traders by providing lower transaction costs and better opportunities to enter or exit positions at desired price points. For instance, in the USD/JPY pair, because of the continuous high demand and supply, a trader can execute large trades without a significant impact on the currency’s price.
Low spreads
The spread, which is the difference between the buying and selling price, tends to be narrower in major currency pairs. Lower spreads mean lower trading costs.
For example, the spread on the EUR/USD pair is often as low as 1 pip (the smallest price move in a currency), which makes it more cost-effective for traders.
Economic influence
Majors are heavily influenced by economic announcements from their respective countries. For example, if the U.S. Federal Reserve announces an interest rate increase, it typically strengthens the USD and impacts pairs like the GBP/USD or AUD/USD.
Traders can use these events to predict market movements and plan their trades accordingly.
Political events
Political stability or instability can affect currency values. For instance, major political events like the Brexit referendum caused significant volatility in GBP/USD.
It was because traders reacted to the uncertainty and potential economic impacts on the UK and Europe.
Ease of access and information availability
Given their importance, there is a wealth of information available about major pairs from a variety of sources including financial news, market analysis, and economic indicators.
This abundance of information makes it easier for traders to make informed decisions.
Due to their high liquidity, major pairs are often more amenable to technical analysis, a method of evaluating securities by analyzing statistics generated by market activity such as past prices and volume.
Trends, patterns, and support/resistance levels are more discernible and reliable in these pairs. For example, traders can use technical indicators like moving averages (MA) or RSI (Relative Strength Index) to gauge the strength of the EUR/USD market and identify potential entry or exit points.
Understanding Minors and their market dynamics
Exotic currency pairs typically include a major currency paired with the currency of a smaller or emerging economy, such as the Brazilian Real (BRL), Turkish Lira (TRY), or South African Rand (ZAR).
These pairs are less commonly traded than major or minor pairs and thus exhibit unique characteristics and challenges. So, what are they:
High volatility
Exotic pairs are renowned for their high volatility. This volatility stems from the relative instability of the economies represented by the lesser-known currencies.
For example, the USD/TRY pair can experience sharp price movements due to economic or political uncertainty in Turkey. This high volatility can present significant profit opportunities for traders who can enter and exit positions at the right times.
Economic changes
The economies of emerging markets are often prone to rapid changes in inflation, interest rates, and government policies, which can all cause significant fluctuations in currency values.
For instance, if an emerging country announces higher than expected inflation rates, its currency might depreciate quickly against major currencies like the USD. Traders monitoring such economic indicators can capitalise on these movements.
Unlike major pairs, exotics are not as liquid, meaning there are fewer buyers and sellers at any given time. This lower liquidity can result in higher spreads — the difference between the buying and selling price — which increases trading costs.
Additionally, the lower liquidity can lead to slippage. This refers to the execution price of a trade differs from the expected price, particularly during high volatility or when large orders are placed.
For example, a trader wanting to sell USD/ZAR might find their trade executed at a lower rate than anticipated if market liquidity is low.
Political risk
Emerging markets are often more vulnerable to political instability, which can have drastic effects on their currency values. For instance, political unrest in South Africa could lead to a sudden decrease in the value of the ZAR.
Traders need to stay informed about the political climate in these countries to manage these risks effectively.
Opportunities for astute traders
Despite these challenges, trading exotic pairs can be highly rewarding for knowledgeable traders who understand these markets’ intricacies.
The key is to conduct thorough research and apply robust risk management strategies. Traders might use hedging techniques or set strict stop-loss orders to manage potential losses.
Here’s an example of trading strategy: Consider the scenario where a trader anticipates that the Brazilian central bank will raise interest rates. Such a move could strengthen the BRL. By entering a position in USD/BRL before the rate increase, a trader can potentially profit from a strengthening BRL against the USD.
Exotic pairs are intriguing for those looking to capitalize on the volatility. These pairs react vividly to changes in the economic stability of the emerging nations involved.
However, this volatility comes with risks, including higher spreads and lower liquidity, which can lead to slippage and larger losses if not managed properly.
These pairs are typically formed by pairing a major currency like the US Dollar (USD) or Euro (EUR) with the currency of a developing or smaller economy such as the Turkish Lira (TRY) or South African Rand (ZAR).
Exotic pairs are notably volatile due to the economic and political instability often seen in emerging markets. For example, the USD/TRY pair can experience significant fluctuations following political events in Turkey or changes in US economic policy.
This volatility can lead to large price swings within very short periods, providing the potential for substantial profits if these moves are predicted correctly.
Given the risks associated with exotic pairs, traders often use specific strategies to mitigate potential losses. For instance, setting tight stop-loss orders can help limit losses during sudden market downturns. Moreover, using smaller trade sizes or leverage can reduce the impact of volatility on the trading account.
How economic factors affect different currency pairs
Understanding how economic factors affect different currency pairs is fundamental to successful Forex trading.
Economic indicators like GDP growth, unemployment figures, and inflation data play a critical role in influencing the valuation of currencies in the Forex market.
Below, we’ll delve deeper into these concepts and provide examples to illustrate their impact:
GDP growth rates
GDP (Gross Domestic Product) is a primary indicator of a country’s economic health. A higher- than- expected GDP growth rate generally strengthens a country’s currency because it indicates a robust economy.
For instance, if the U.S. reports a GDP growth rate that surpasses analysts’ forecasts, it could lead to a strengthening of the USD against other major currencies like the EUR and JPY. Conversely, a decline in GDP can weaken a currency due to reduced investor confidence in the economy.
Unemployment figures
Employment levels are directly correlated with consumer spending. High unemployment rates typically indicate economic distress, leading to weaker currency values.
For example, if Australia releases higher than expected unemployment rates, the AUD might depreciate against major pairs like the USD and EUR. Traders monitor these releases closely as they can lead to immediate impacts on currency values.
Inflation data
Inflation is another critical economic indicator. Central banks adjust interest rates to control inflation, and these interest rate changes directly affect currency strength.
For instance, if the UK reports higher inflation and the Bank of England hints at raising interest rates, the GBP might strengthen against other currencies, as higher interest rates offer better returns to currency holders.
Examples of How Economic Factors Affect Currency Pairs
Major Pairs: The EUR/USD pair is highly sensitive to economic releases from both the Eurozone and the U.S. For example, if the U.S. Federal Reserve announces an unexpected interest rate hike, the USD typically strengthens against the EUR. Similarly, strong economic growth in the Eurozone could boost the EUR against the USD.
Minor Pairs: Consider the EUR/JPY. This pair is influenced by economic data from both Europe and Japan. If Japan reports a recession while Europe shows robust economic health, the EUR/JPY might rise as the Euro strengthens against the Yen.
Exotic Pairs: An example of exotic pairs could be USD/ZAR (U.S. Dollar/South African Rand). South Africa’s economic indicators like mining production or political stability can drastically affect the ZAR. If South Africa enters a political crisis, it could lead to a depreciation of the ZAR against the USD.
Tips for choosing the right currency pairs for your trading style
Choosing the right currency pairs for your trading portfolio is a fundamental decision that aligns closely with your individual trading style, risk tolerance, and market expertise.
Here are more detailed tips and examples to help both novice and seasoned traders make informed decisions:
#1. Assess your risk tolerance
Understanding your comfort level with risk is crucial. Major currency pairs like EUR/USD, USD/JPY, and GBP/USD offer lower volatility and thus, lower risk. They are ideal for beginners or those with a low risk tolerance.
These pairs often have more predictable market movements and tighter spreads, making them easier and cheaper to trade.
#2. Define your trading strategy
Your strategy should dictate the currency pairs you choose. If you engage in scalping or day trading, you might prefer major pairs because of their liquidity and tight spreads, which allow for quick trades at minimal transaction costs.
Conversely, if you’re a swing trader or looking for long-term investments, minor or exotic pairs might be appealing due to their potential for large movements based on economic changes within their specific countries.
#3. Consider market hours
Different currency pairs are more active during specific market hours. For example, if you are trading from Asia, you might find more opportunities trading pairs like AUD/USD or USD/JPY during the Australian and Tokyo market hours. Choosing pairs that are active during your trading hours can provide more opportunities for profit.
#4. Evaluate Economic Exposure:
Understand the economic factors that influence different currencies. If you are well-versed in the economic conditions of Europe, you might be more comfortable trading EUR-based pairs. Similarly, if you have a strong grasp of the Asian markets, pairs involving the JPY or AUD could be more suitable.
A beginner might start with the EUR/USD because it’s one of the most traded pairs with abundant market information and analysis available. Its low volatility and high liquidity make it less susceptible to sudden market shifts, providing a more forgiving environment for new traders.
Someone who prefers minimal risk might lean towards pairs like USD/CHF. The Swiss Franc is often considered a ‘safe-haven’ currency that remains stable during economic uncertainty, making this pair less volatile.
A trader seeking higher risk and potentially higher returns might look at exotic pairs like EUR/TRY. The Turkish Lira can exhibit significant volatility due to Turkey’s economic susceptibility to political changes and other macroeconomic factors, offering the potential for substantial profits.
For technical traders
A trader who relies heavily on technical analysis might prefer USD/JPY, as this pair often respects technical levels and patterns due to the high volume of professional trading activity.
Whatever pairs you choose, it’s important they align with your overall trading goals and the time you can dedicate to monitoring the markets. For example:
Time-Constrained Trader: If you can’t monitor the markets frequently, trading major pairs on longer timeframes might be more suitable because you can use end-of-day trading strategies and won’t need to manage trades as frequently.
Full-Time Trader: If trading is your full-time occupation, you might expand your portfolio to include a mix of major, minor, and exotic pairs, capitalizing on different market conditions and diversifying your trading opportunities.
Selecting the right currency pairs is a personalized decision that should be based on a thorough analysis of your trading style, risk tolerance, market knowledge, and availability. By carefully aligning your choices with these factors, you can enhance your chances for success and satisfaction in the Forex market.
Wrapping Up
Whether you prefer the stability of major pairs, the balanced risk of minors, or the adventurous nature of exotics, the Forex market offers diverse opportunities for personal and financial growth.
By understanding the unique characteristics and economic drivers of these pairs, you can better navigate the complex Forex landscape.
Ready to take your trading to the next level? Download the VT Markets app today and harness the power of strategic trading tailored to your preferences. Join us and start trading the smart way!
Please note that the dividends of the following products will be adjusted accordingly. Index dividends will be executed separately through a balance statement directly to your trading account, and the comment will be in the following format “Div & Product Name & Net Volume ”.
Please refer to the table below for more details:
The above data is for reference only, please refer to the MT4/MT5 software for specific data.
If you’d like more information, please don’t hesitate to contact info@vtmarkets.com.
As part of our commitment to provide the most reliable service to our clients, there will be VT APP maintenance this weekend.
Maintenance Hours:
8th of June 2024 (Saturday) 00:00 – 02:00 (GMT+3)
Please note that the following aspects might be affected during the maintenance:
1. During maintenance hours, VT APP will not be able to log in. Please log in to the client portal to manage your account during this period.
Please refer to the VT APP for the latest update on the completion and market opening time.
Thank you for your patience and understanding about this important initiative.
If you’d like more information, please don’t hesitate to contact info@vtmarkets.com