The Forex market’s landscape is constantly evolving, with various countries emerging as key players based on the number of active traders.
In 2023, according to data provided by Forex Broker Report, there’s been a significant global distribution of Forex traders. This spread is largely influenced by the intricate dynamics of advanced financial systems and regulatory frameworks.
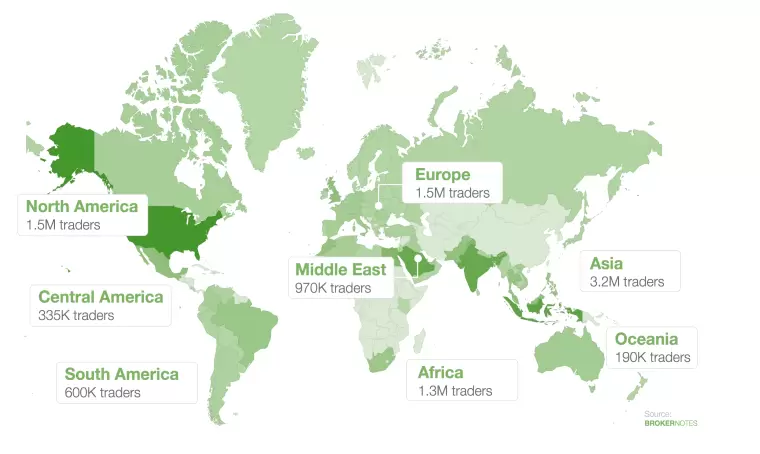
Source: Broker Notes
The global distribution of online Forex traders, as highlighted in the ForexBrokers.com report, shows a notable regional variance: Asia leads with 3.2 million online traders, Europe follows with 1.5 million, and Africa with 1.3 million, while the United States also shows a substantial presence in the Forex market. These figures underscore the widespread popularity and varied levels of Forex trading engagement across different regions.
As we delve into the top 10 countries at the forefront of Forex trading, each presents a unique combination of attributes and challenges within their Forex markets.
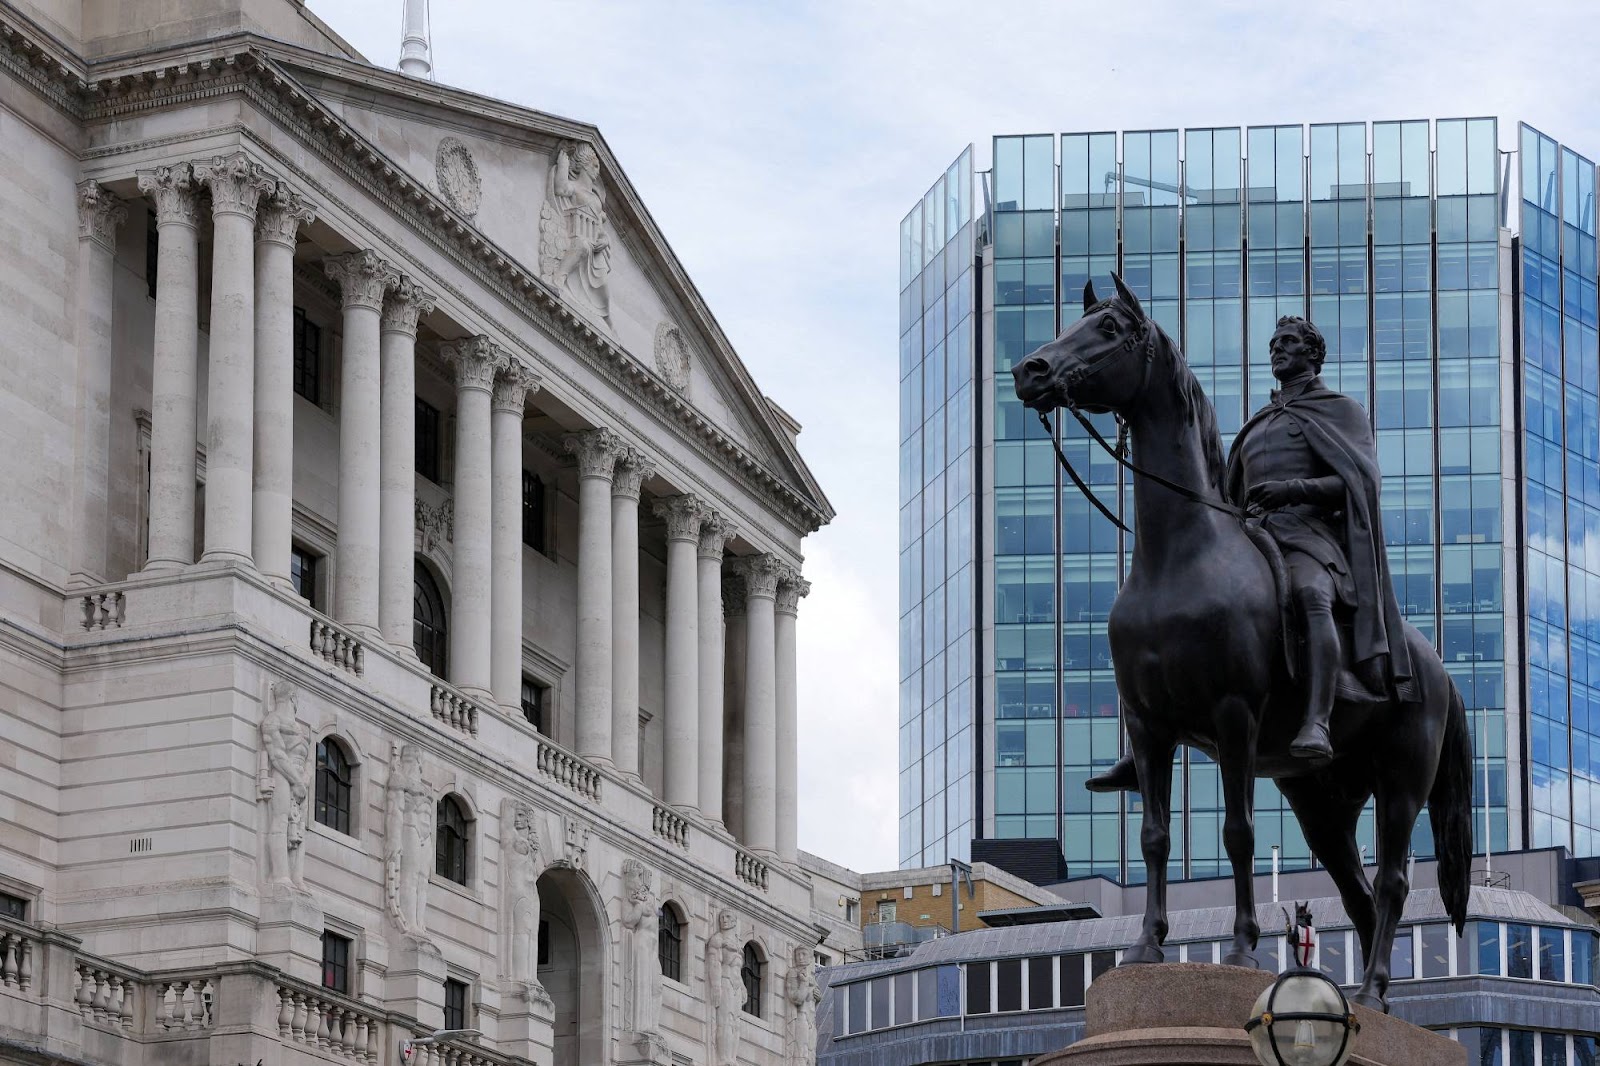
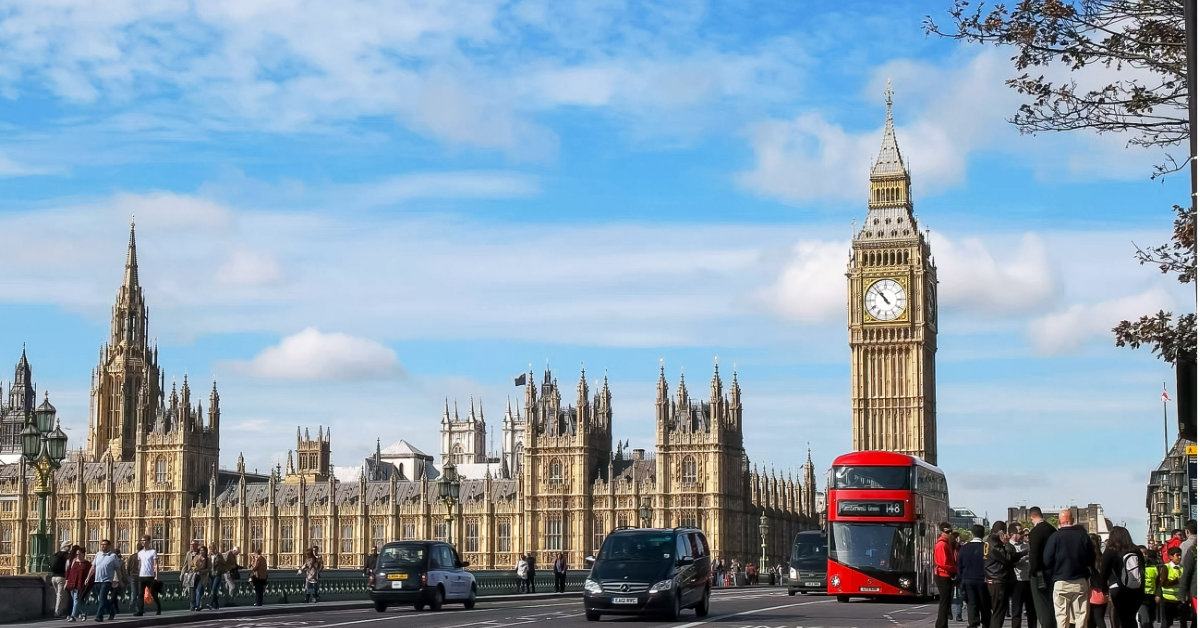
1. United Kingdom (341,000 Traders)

The UK, especially London, is not just Europe’s but one of the world’s foremost financial hubs. The Financial Conduct Authority (FCA) provides robust regulation, ensuring transparency and trader protection. London’s time zone advantageously positions it to capitalise on both Asian and American market hours, enhancing its Forex trading activity.
2. United States (335,000 Traders)
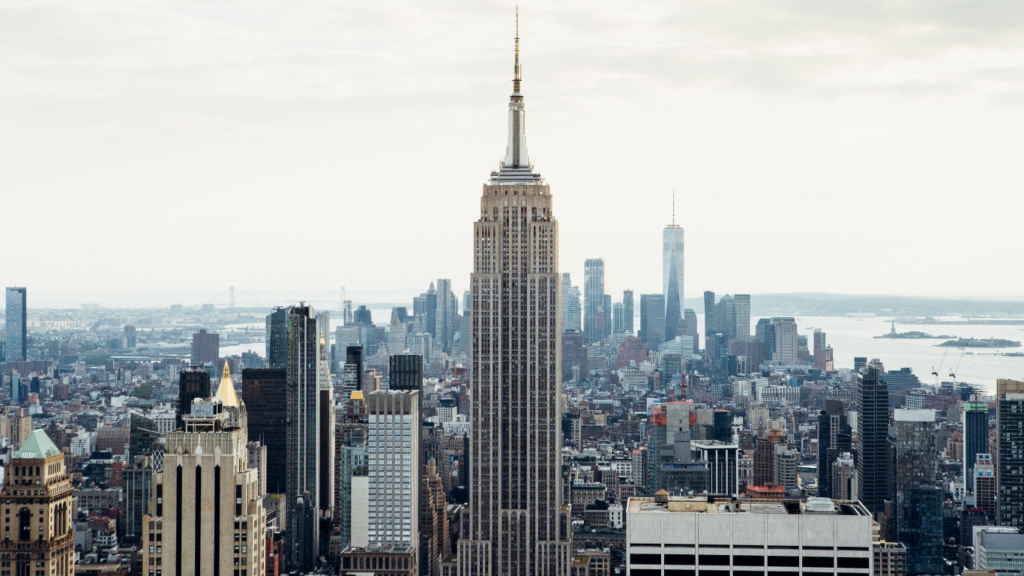
The U.S. boasts a highly developed financial market with extensive Forex trading activity. The regulatory environment, overseen by organisations like the CFTC and NFA, ensures a secure trading platform for a diverse array of traders. The U.S. dollar’s dominance in global finance further amplifies the country’s role in the Forex market.
3. Japan (223,000 Traders)
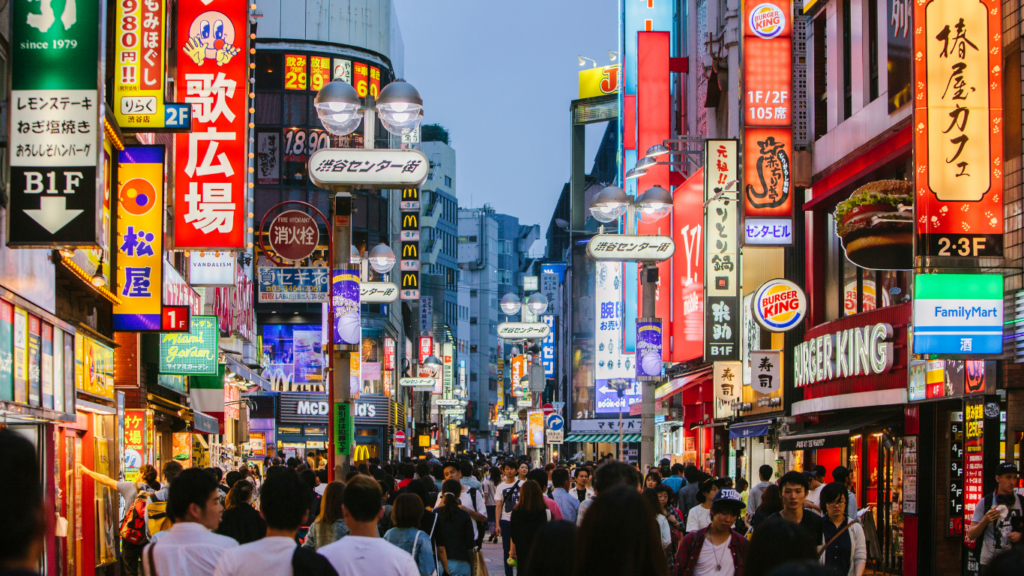
Japan’s Forex market has witnessed exponential growth since retail Forex trading was legalised in 1998. The Japanese yen, a major currency in Forex markets, is often involved in carry trades due to Japan’s low-interest-rate environment. The Financial Services Agency (FSA) maintains a well-regulated trading environment, balancing openness with trader protection.
4. Singapore (218,000 Traders)

As a critical financial centre in Asia, Singapore’s strategic location enables significant trading overlap with global markets. The Monetary Authority of Singapore (MAS) is known for its stringent regulatory standards, fostering a secure and efficient trading environment. Singapore’s advanced technological infrastructure also contributes to its robust Forex market.
5. Hong Kong (200,000 Traders)

Hong Kong stands as a significant gateway to Asian markets, with a stable economy and a strong regulatory framework. The Hong Kong dollar is a crucial currency in Forex markets, and the region’s proximity to mainland China adds to its strategic trading position. Hong Kong’s sophisticated financial services sector attracts traders globally.
6. Australia (195,000 Traders)

Australia’s Forex market is underpinned by its resource-driven economy and political stability. Regulated by the Australian Securities and Investments Commission (ASIC), the market offers a safe environment for traders. The Australian dollar, a commodity currency, is highly influenced by the country’s trade dynamics, particularly with China.
7. Switzerland (182,000 Traders)

Switzerland’s reputation for financial stability and banking secrecy makes its Forex market attractive. The Swiss Franc, a safe-haven currency, is a popular choice during global economic uncertainties. Switzerland’s Forex market benefits from its neutrality and the country’s stringent regulatory practices.
8. France (120,000 Traders)

France’s Forex market is integral to the Eurozone. The Euro’s strength and stability, combined with France’s significant economic position in Europe, make it a key player in Forex trading. The Autorité des Marchés Financiers (AMF) ensures a well-regulated trading environment.
9. Germany (109,000 Traders)
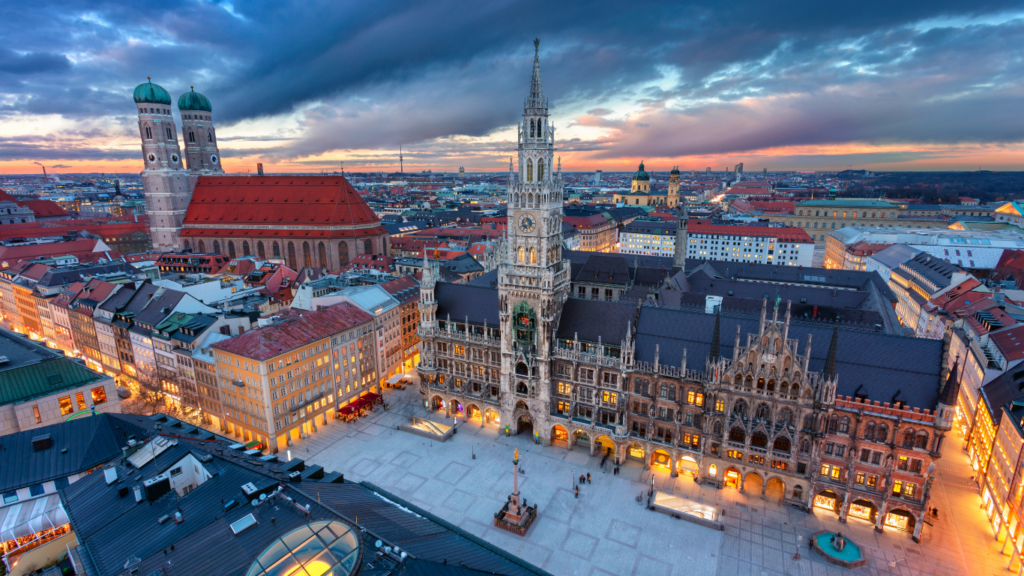
Germany’s robust economy and the Euro’s prominence bolster its Forex market. Germany’s Forex trading is influenced by its strong industrial and export sectors. The Federal Financial Supervisory Authority (BaFin) provides a stringent regulatory framework, ensuring market integrity.
10. China (105,000 Traders)

China’s growing Forex market reflects its rising economic power. The Chinese Yuan’s increasing inclusion in global Forex trading symbolises China’s expanding financial influence. However, the market is more regulated and less open than in other major countries, with strict oversight from the People’s Bank of China and SAFE.
In conclusion, the Forex trading landscape in 2023 highlights the diversity and dynamism of global financial markets. Each of the top 10 countries offers unique advantages and challenges, shaped by their respective economic conditions, regulatory frameworks, and currency strengths. These nations not only provide significant opportunities for Forex traders but also play a crucial role in shaping the future of international finance and trade.