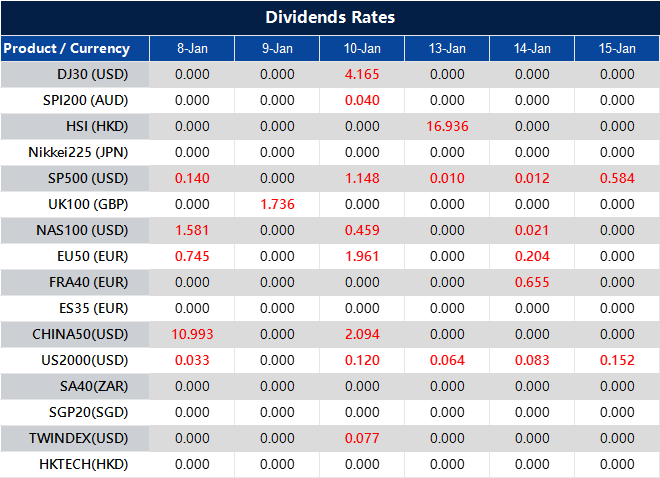
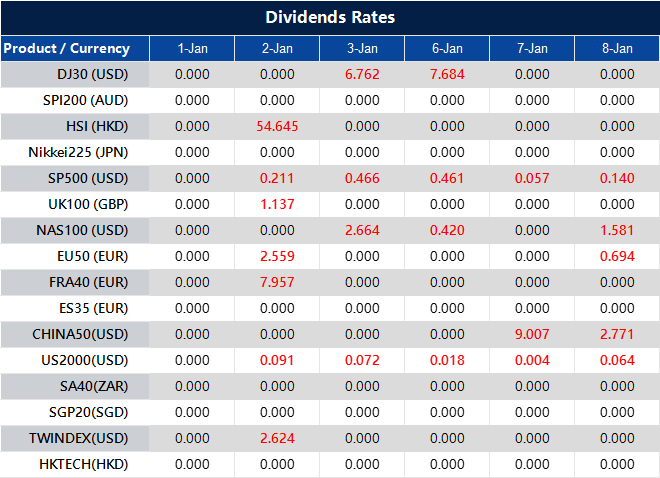
Please note that the dividends of the following products will be adjusted accordingly. Index dividends will be executed separately through a balance statement directly to your trading account, and the comment will be in the following format “Div & Product Name & Net Volume ”.
Please refer to the table below for more details:
The above data is for reference only, please refer to the MT4/MT5 software for specific data.
If you’d like more information, please don’t hesitate to contact info@vtmarkets.com.
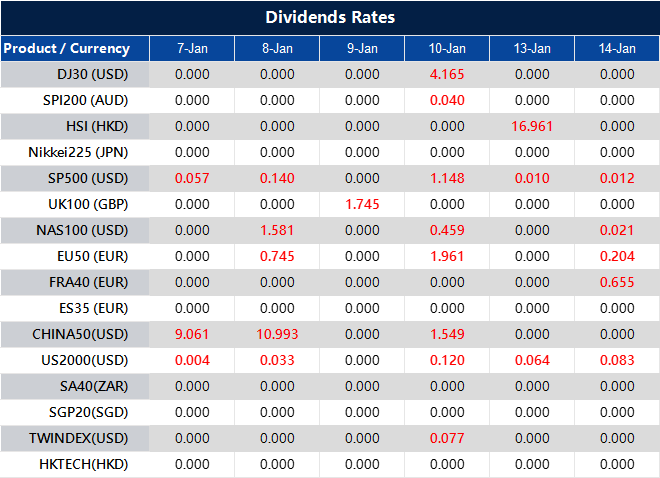
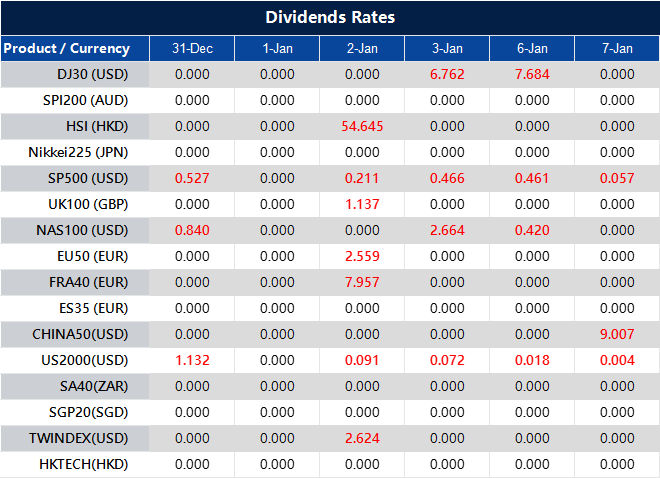
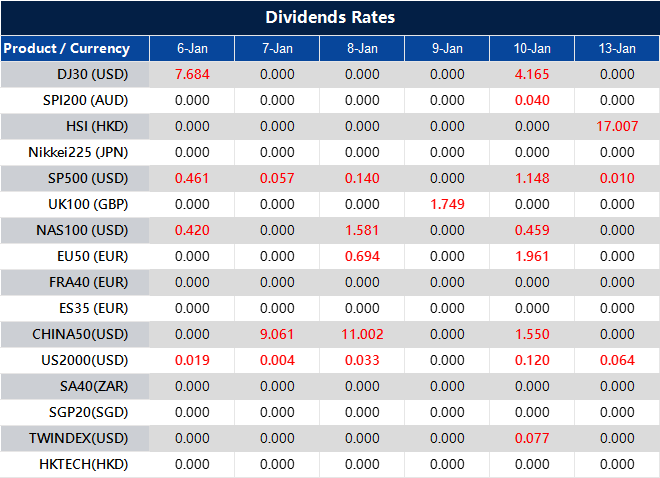
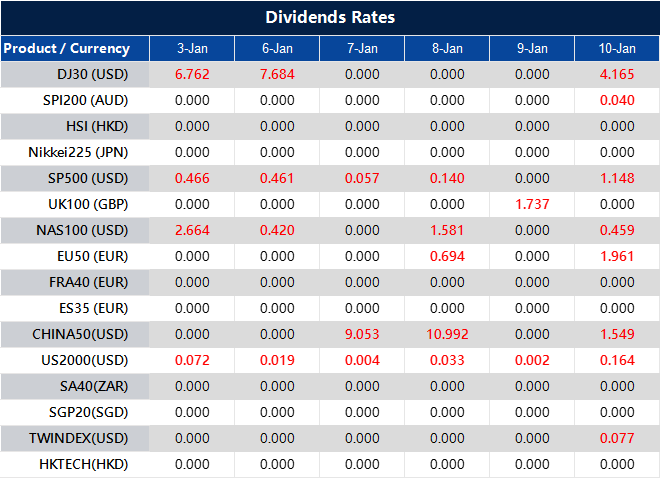
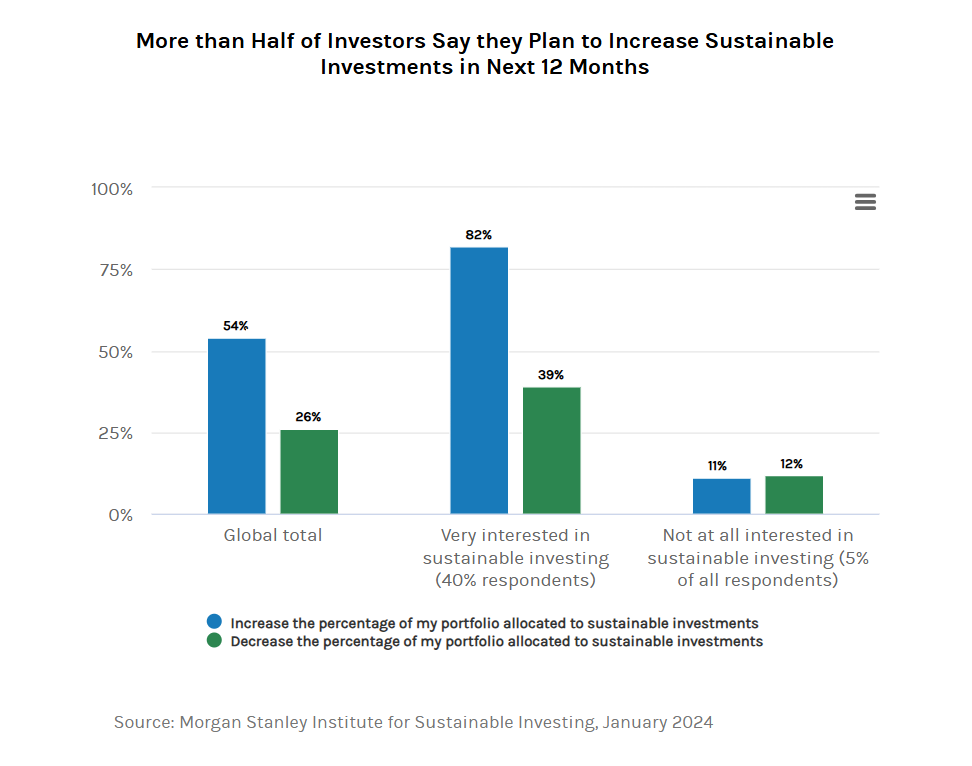
In today’s world, investors increasingly want their money to do more than just generate returns. They’re looking to make a positive impact whilst growing their wealth. This shift in mindset has given rise to ESG investing, an approach that’s reshaping the investment landscape. In fact, ESG assets are projected to reach a staggering USD 53 trillion by 2025.
But what exactly is ESG investing, and why should you care? The concept gained prominence with the UN’s 2004 “Who Cares Wins” report, which first linked sustainability to profitability, and has since evolved into a powerful force in modern investing.
Understanding ESG
ESG stands for Environmental, Social, and Governance – three key factors used to evaluate companies’ sustainability and ethical impact. Think of these as different lenses through which to view potential investments.
The Environmental aspect, currently prioritised by 42% of investors, focuses on how companies interact with the natural world. This includes their approach to climate change, pollution, and waste management. For instance, Apple has committed to becoming carbon neutral by 2030, demonstrating strong environmental credentials that could appeal to ESG investors.
The Social component, which 27% of investors now prioritise, examines how companies manage relationships with their employees, suppliers, customers, and communities. This encompasses workplace conditions, diversity initiatives, and human rights practices. Companies with strong social scores often demonstrate better employee retention and customer loyalty.
Governance, valued by 31% of investors, looks at how companies are run. This includes board diversity, executive pay, shareholder rights, and anti-corruption measures. Good governance often translates to better risk management and more sustainable business practices.
The survey findings underline a growing interest in social and governance aspects, even as environmental concerns remain significant, shaping how investors assess sustainability in their portfolios.
The current state of ESG
The ESG landscape is evolving rapidly, but it’s important to understand how investors are actually approaching it. Currently, only 7% of investors fully commit their portfolios to ESG principles, while 28% consider ESG factors alongside traditional financial metrics. This suggests a pragmatic approach rather than an all-or-nothing stance.
Regional differences in Europe are noteworthy. Belgian investors are particularly enthusiastic, with 62% planning to increase their ESG investments. Spanish investors show strong optimism about returns, with 40% believing ESG improves financial performance. Meanwhile, German investors tend to be more cautious, with only 20% expecting enhanced returns from ESG investments.
Why consider ESG?
The case for ESG investing goes beyond ethical considerations. While 32% of investors believe ESG factors improve returns (down from 41% in 2022), 41% see it as an effective risk management tool. This perspective is particularly relevant in today’s rapidly changing business environment.
Looking at real-world examples, companies with strong ESG practices often demonstrate resilience and innovation. Cisco, for instance, has achieved 85% renewable energy usage, potentially reducing its exposure to energy price volatility and environmental regulations. Verizon’s successful USD 1 billion green bond initiative shows how companies can fund sustainable projects while attracting investors.
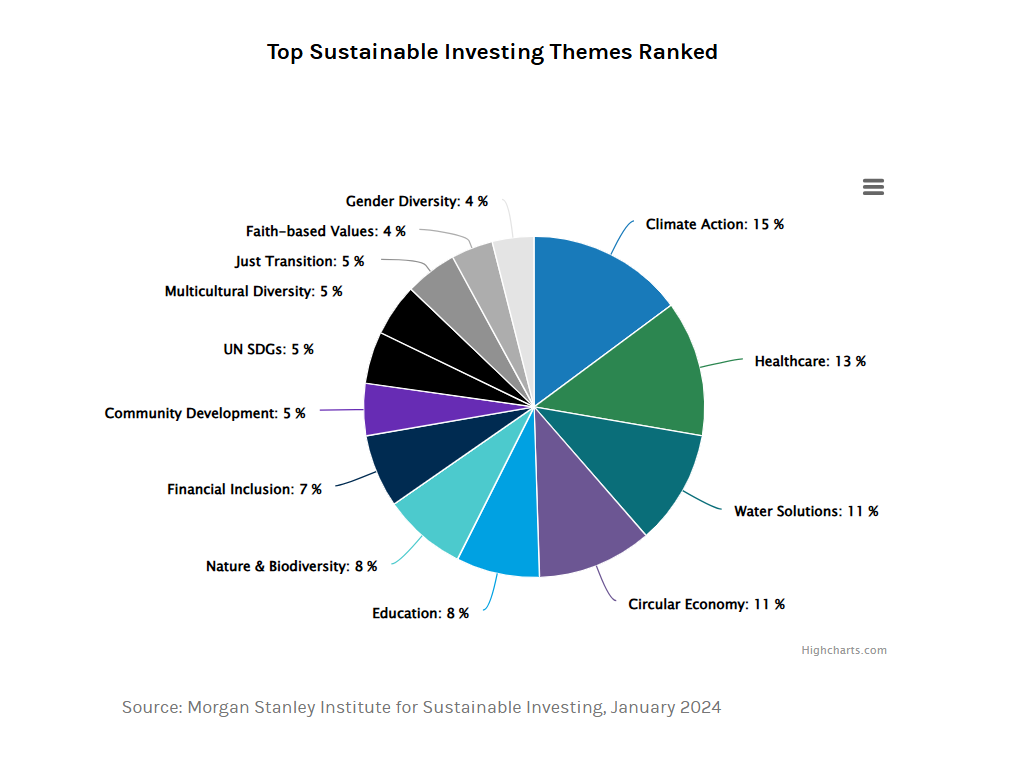
The future of ESG investing appears closely tied to technological advancement and environmental challenges. In the short term, artificial intelligence and digitalisation are expected to drive performance. Longer-term, issues like climate risk and ocean conservation (the Blue Economy) are likely to become increasingly important investment considerations.
Getting started
For those interested in ESG investing, several accessible options exist. Single stocks and Exchange-Traded Funds (ETFs) are the most popular vehicles, offering different levels of diversification and control. ETFs can be particularly useful for beginners, providing exposure to a basket of ESG-screened companies.
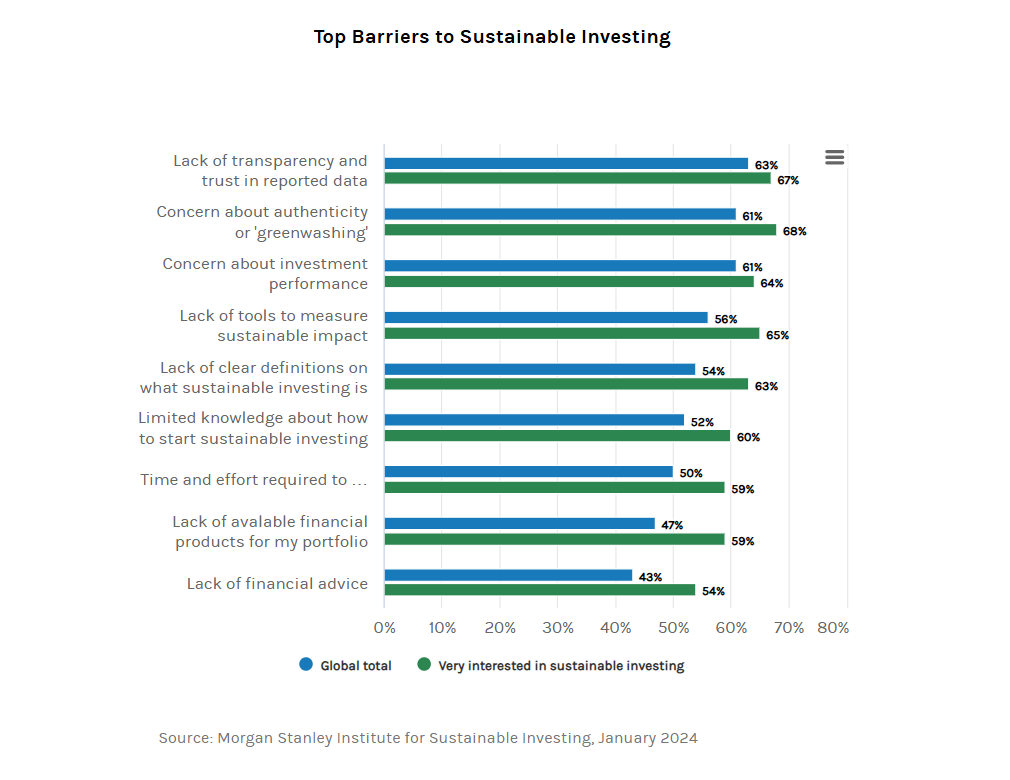
However, challenges exist. Only 3% of investors consider themselves advanced in ESG investing, and many struggle with understanding ESG ratings and data. When starting out, consider these practical steps:
Step 1.Decide your priorities within the ESG framework. Think about which of the three ESG pillars—environmental, social, or governance—matters most to you. For example, you might prioritise companies addressing climate change or those fostering workplace diversity.
Step 2.Research ESG-focused funds or companies that align with these priorities. Look into ETFs, mutual funds, or individual companies with strong ESG credentials. Check their sustainability reports and ratings to see how well they align with your values.
Step 3.Understand that ESG ratings can vary between providers. Ratings are not standardised, and different agencies might assess the same company differently. Make sure to explore multiple sources and interpret the data in context.
Step 4.Start small and gradually increase exposure as you become more comfortable. Begin with a modest investment to understand the nuances of ESG investing without taking on excessive risk. As you gain confidence, consider diversifying further.
Step 5.Keep track of both financial and ESG performance. Monitor how your investments perform financially while also evaluating their impact on the ESG metrics you care about. This dual focus will help you make adjustments as needed.
It’s also worth noting that different regions emphasise different aspects of ESG. For example, Italian investors particularly value social factors, while other markets might prioritise environmental or governance considerations. This diversity allows investors to align their portfolios with their specific values and goals.
Conclusion
ESG investing is evolving, influenced by changing regulations, technological progress, and shifting societal priorities. While some scepticism about returns remains, the focus on risk management and long-term sustainability is strong.
For investors, ESG presents an opportunity to align investments with personal values while managing risks and seizing opportunities in a sustainable economy. The key is to maintain clear objectives, realistic expectations, and a long-term perspective.
Whether starting out or adapting your portfolio, understanding ESG factors can help make more informed investment decisions. As the investment landscape evolves, ESG considerations will become increasingly important for all investors.
Start exploring ESG opportunities today by opening a live account with VT Markets and unlocking your investment potential.
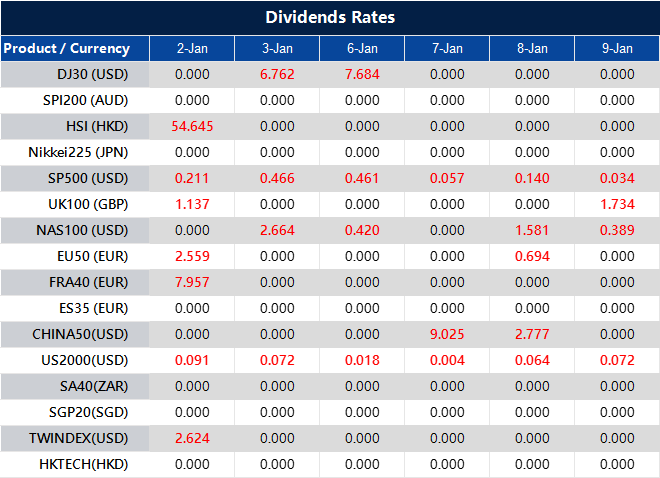
Please note that the dividends of the following products will be adjusted accordingly. Index dividends will be executed separately through a balance statement directly to your trading account, and the comment will be in the following format “Div & Product Name & Net Volume ”.
Please refer to the table below for more details:
The above data is for reference only, please refer to the MT4/MT5 software for specific data.
If you’d like more information, please don’t hesitate to contact info@vtmarkets.com.
Written on December 31, 2024 at 7:22 am, by anakin


