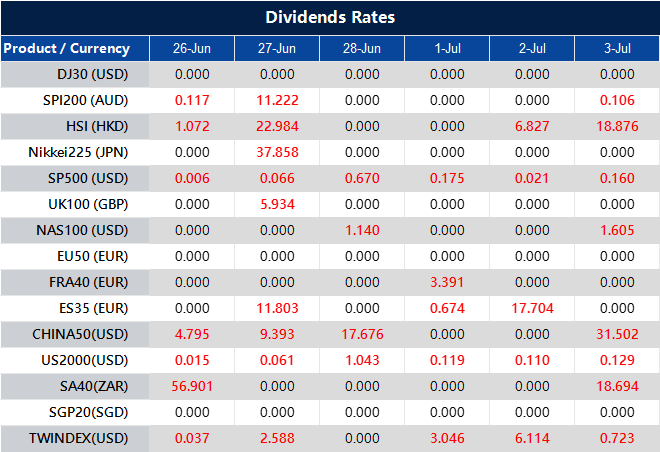
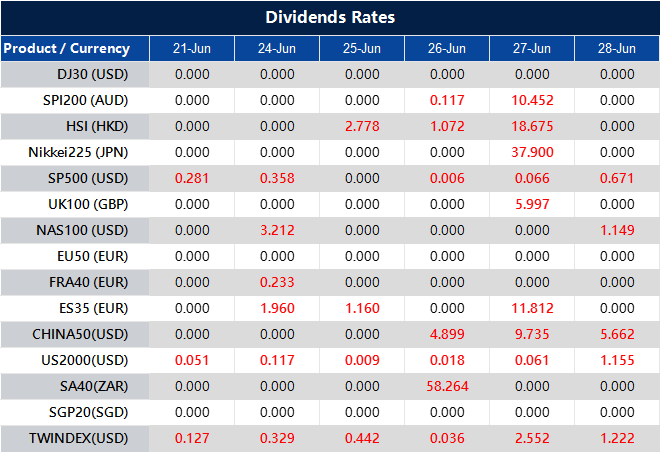
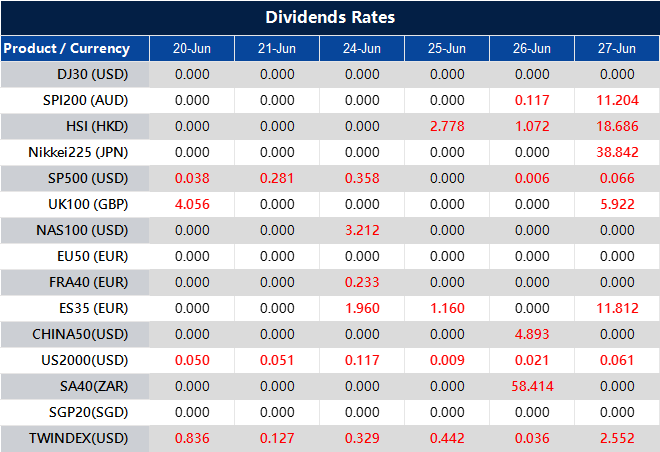
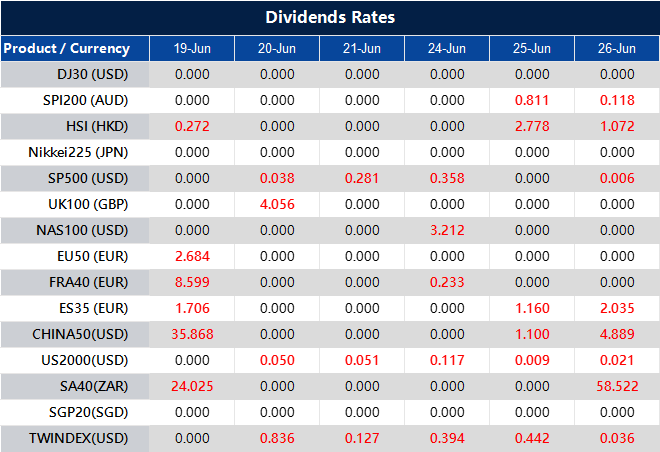
Please note that the dividends of the following products will be adjusted accordingly. Index dividends will be executed separately through a balance statement directly to your trading account, and the comment will be in the following format “Div & Product Name & Net Volume ”.
Please refer to the table below for more details:
The above data is for reference only, please refer to the MT4/MT5 software for specific data.
If you’d like more information, please don’t hesitate to contact info@vtmarkets.com.
Shares product NKLA is about to conduct a share reverse split after the market closes on June 24, 2024. Starting from the market opening on June 25, 2024, NKLA expects to provide investor trading in divided contracts.
After the share reverse split, please be aware of the following:
1. The trading volume of NKLA open positions will become 1/30 of the original lot size.
2. The “opening price” and “take-profit/stop-loss setting price” of NKLA’s positions will become 30 times the original price.
3. NKLA’s price at the opening of the market on June 25 is expected to be approximately 30 times the closing price.
The above data is for reference only; please refer to the MT5 software for specific data.
If you’d like more information, please don’t hesitate to contact info@vtmarkets.com.
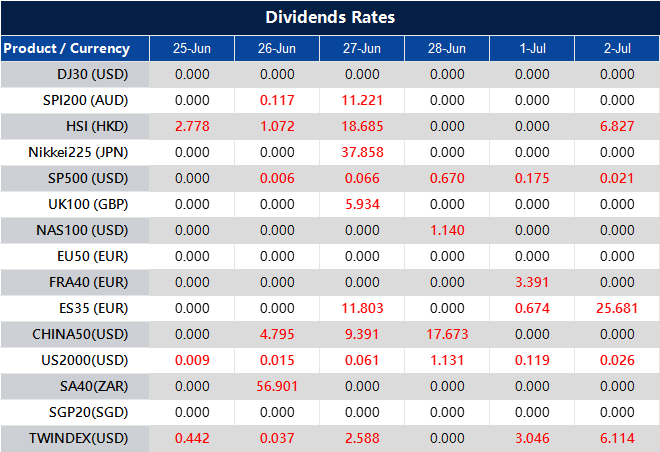
Please note that the dividends of the following products will be adjusted accordingly. Index dividends will be executed separately through a balance statement directly to your trading account, and the comment will be in the following format “Div & Product Name & Net Volume ”.
Please refer to the table below for more details:
The above data is for reference only, please refer to the MT4/MT5 software for specific data.
If you’d like more information, please don’t hesitate to contact info@vtmarkets.com.
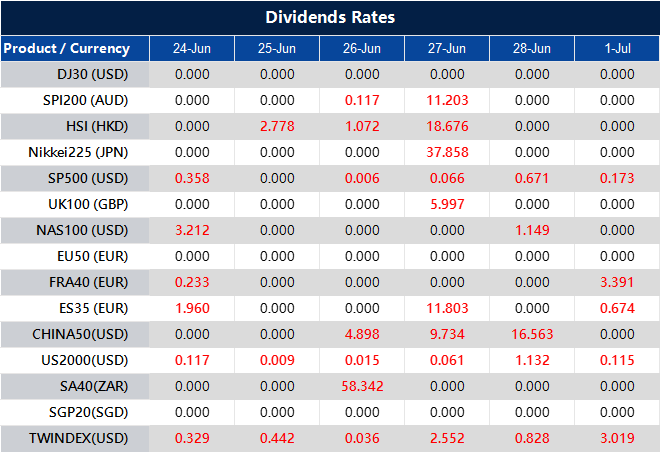
Making thousands of dollars within a few clicks? Yes please!
That is the social appeal of forex trading. The instant gratification and the adrenalin rush can often blur the line between strategically trading the markets and gambling.
To sustain as a profitable forex trader long term, however, is beyond clicking the “trade” button in seeking the jackpot trade to financial freedom. The reality is successful traders maintain the discipline in risk management every single trade they take.
Only trade when the odds are in your favour
As a start, it is important to understand the dynamics of the market being traded. Every asset class has its own patterns and psychological price trigger points. But in general, most traders analyse the market with two common approaches: Technical analysis and fundamental analysis.
Technical analysis
Primarily, technical analysis is chart reading. By relying on past data in the form of indicators and price actions, one can plan a trade with the belief that the buying and selling actions of the market reflect the sentiment tied to a particular financial instrument. Indicators such as chart patterns, support and resistance levels, price trends, moving averages as well as volume and momentum indicators all fall under technical analysis.
Another aspect of analysing a market is by looking at the intrinsic value of an underlying asset via related economic and financial factors. These include macroeconomic factors, such as the state of the economy and industry conditions; to microeconomic factors, like the effectiveness of the management of a company.
Fundamental analysis tends to point to the long-term direction of an asset class. However, majority of CFD trading are short term in nature, and as such fundamental analysis tends to receive less attention.
Developing your own trading plan, and sticking to it
A trader can decide based on technical and/or fundamental analysis whether the odds favour opening a trade position in the market. However, a trading strategy must entail the level of risk exposure undertaken, and the trader must psychologically accept the risk level as planned.
Without a proper risk management strategy, opening any position in the financial markets is no different from gambling. This is how most traders have their accounts wiped out and never trade again in their lives.
The 2% rule
A good way to start is by looking at the trading capital of any given account. The common practice among traders is to risk no more than 2% of trading capital per transaction. This is also known as “the 2% rule”.
For example, in a $500 account, the maximum loss should be limited to:
2% x $500 = $10 per trade
The rationale behind this rule is founded in the possibility that a trader can be wrong fifty (50) times in a row before the account is wiped out. This greatly improves the chances of survival for a trader in the long run.
To make the execution of a trading strategy more effective, a trader can use the Stop Loss and Take Profit feature to ensure that the risk level initially planned will be adhered to. By setting a stop loss or take profit order, not only a trader can relax without staring at the screen all the time, but also remove the possibility of making an emotional decision.
Is the risk worth the reward?
The risk to reward ratio marks the potential profit a trader can earn for every dollar risked on a trade. This is used to justify if the risk is worth taking for the reward one can potential. A trade with a risk to reward ratio of 1:7 would mean that that a trader is risking $1 for the chance of earning $7.
Obviously, the higher the reward makes a trade more attractive to take, and this is how traders often plan which trades to take. The more experienced a trader is, the more he knows being selective in opening trade positions would help in surviving the markets.
Leverage: The double-edge sword
Put simply, leverage is the use of money of the broker rather than the strict use of your own, which is very common in the CFD trading industry. A trader could put down a deposit of just $500 to open trade positions up to $250,000 with 500:1 leverage.
What does that mean?
With every $1 profit you make using your own money, you can make up to 500 times of that. However, the reverse also holds true.
With every $1 profit paper loss you are holding, you will also be holding 500 times of that if your position has not been closed yet.
This is why it is important to balance the use of leverage against the 2% rule. While maxing out on leverage can lead you to the Lambo dream, it often wipes trading account out fast.
Staying cool and calm is the trick
Of all the risks, the hardest risk to manage is the emotion of the trader himself. Learning the details of how to plan a trade is nowhere as challenging as executing the trade without emotion. Often, traders stray away when the market move in a certain direction, not taking profits or stopping losses as planned.
All traders must take responsibility for their own decisions, whether this is a result of failure to plan, unexpected event or just because the trader got emotional himself.
While automation can help to negate emotional decision making, the best way to objectify this is to maintain a trading journal, jotting down the details leading to the success or failure of each trade.
Copy how others manage trading risk
If you are unsure how to manage your trading risk, consider using the Copy trading feature for a start. Copy trading is a form of social trading where new traders can replicate the trades from the seasoned traders. By doing so, you can benefit from the expertise of others as you keep learning about the financial markets.
Profits will follow if risk is managed well
Risk management is one of the most overlooked areas in trading. With a disciplined approach and good trading habits, losses can stay under control and any trader will have a chance of being profitable. Explore 1000+ assets being offered by VT Markets and tart your financial trading journey today!
Imagine you are at the grocery store, and you notice that the prices of many items have increased compared to your last visit. While this might be a frustrating experience for you as a consumer, it’s also a valuable data point for traders and investors who closely monitor inflation trends.
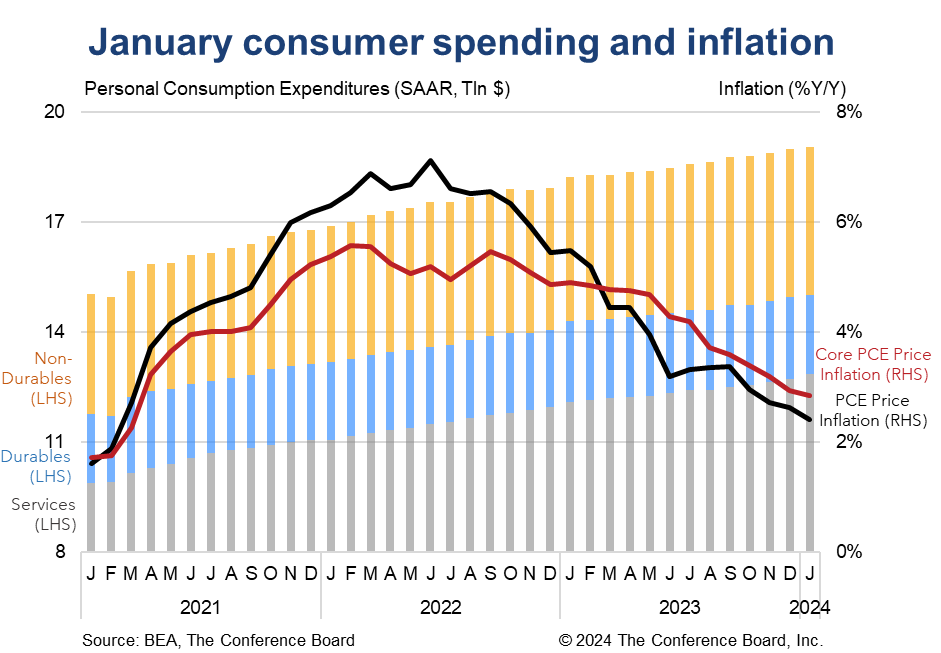
One of the key indicators they rely on is the Personal Consumption Expenditures (PCE) Price Index, a measure of the prices paid by consumers for goods and services in the United States.
As a forex trader, you are constantly on the lookout for economic indicators that can influence market movements and provide trading opportunities. One such indicator is the PCE Price Index, closely watched by the Federal Reserve as a gauge of inflation.
Grasping the nuances of this index can give you valuable insights into the central bank’s monetary policy decisions and their potential impact on currency and commodity markets.
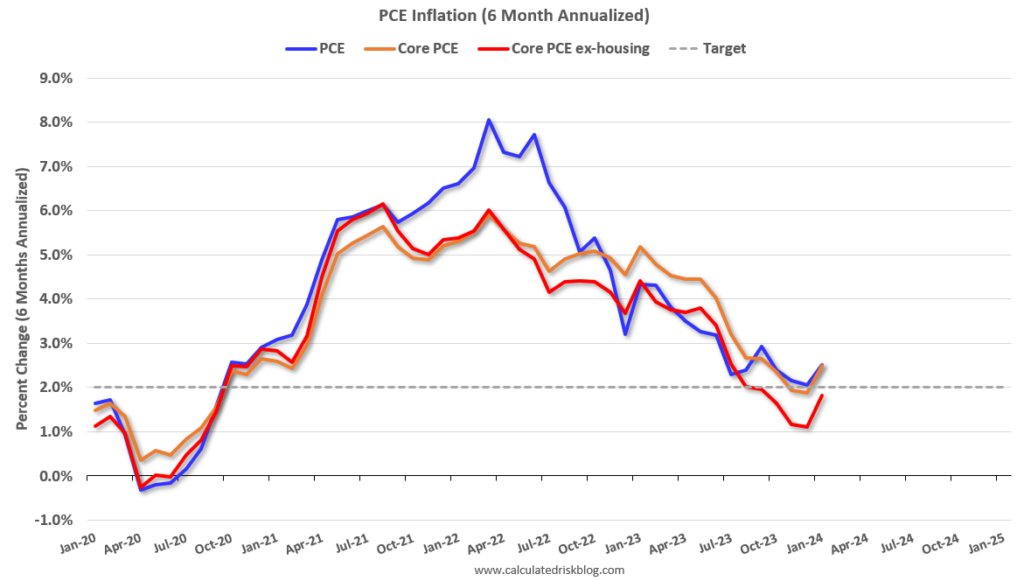
What is the PCE Price Index?
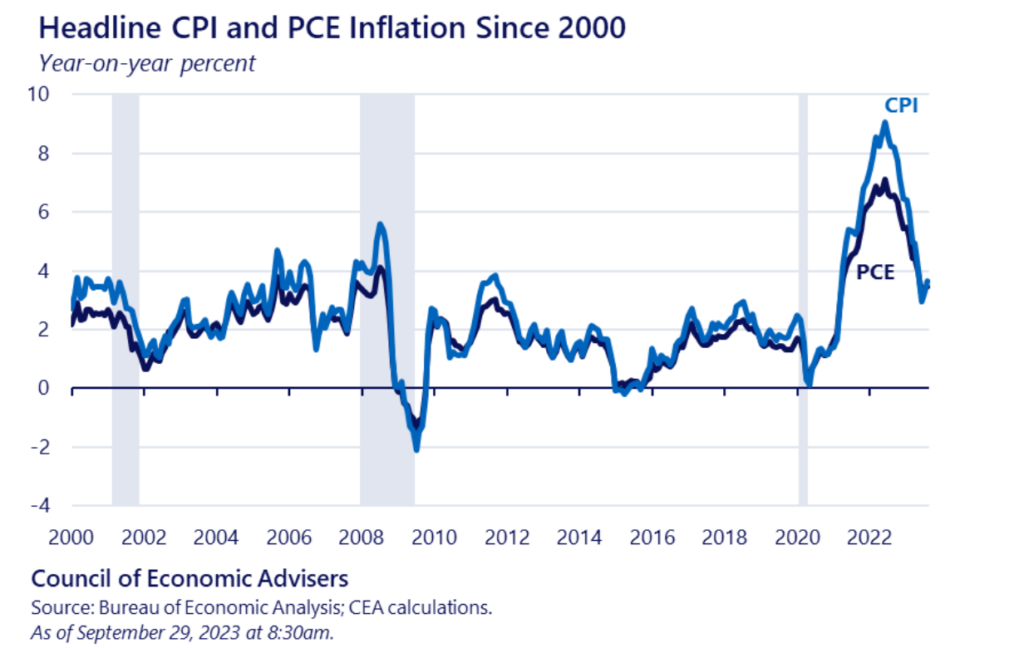
The PCE Price Index is a measure of the prices paid by consumers for goods and services. It is calculated and published by the Bureau of Economic Analysis (BEA), and it serves as one of the key inflation indicators closely monitored by the Federal Reserve.
Unlike the more widely known Consumer Price Index (CPI), the PCE Price Index includes a broader range of consumer spending, including healthcare and housing services.
The PCE Price Index is used to calculate inflation by tracking the percentage change in the prices of the basket of goods and services over time.
Specifically, the BEA compares the cost of this basket in the current period to the cost of the same basket in a base period. The percentage change in the cost represents the rate of inflation or deflation.
For example, if the basket costs USD 100 in the base period and USD 102 in the current period, the PCE Price Index would show a 2% increase, indicating an annual inflation rate of 2%.
This inflation rate is then used by policymakers and investors to gauge the overall price level changes in the economy.
The PCE Price Index is also divided into headline and core measures. The headline index includes all goods and services, while the core index excludes volatile food and energy prices.
The core PCE is often considered a better measure of underlying inflation trends, as it filters out temporary price fluctuations caused by factors such as changes in energy prices.
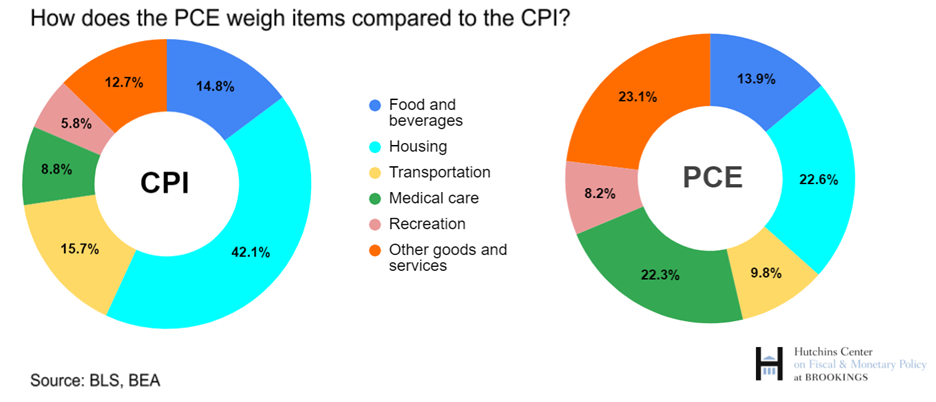
PCE vs CPI: Key differences and advantages
There are several important indices used to measure inflation in the United States, each with its own methodology and focus.
Some of the commonly cited inflation measures include the Producer Price Index (PPI), which tracks prices at the wholesale level, the Import Price Index, monitoring inflation for imported goods, and the Employment Cost Index, focusing on changes in labour costs.
However, the two most widely followed and influential inflation gauges are the Personal Consumption Expenditures Price Index and the Consumer Price Index. While both the PCE and CPI indices measure inflation, there are several key differences between the two.
The CPI is based on a different basket of goods and services, uses different weightings, and does not account for substitution effects, where consumers switch to cheaper alternatives when prices rise.
In contrast, the PCE Price Index is preferred by the Federal Reserve as its primary inflation gauge due to its broader coverage of consumer spending, including services like healthcare and housing. Additionally, the PCE Price Index captures substitution effects, reflecting how consumers adapt their spending patterns as prices change.
Furthermore, the PCE Price Index’s methodology is designed to account for changes in consumer preferences over time. The index is adjusted to reflect shifts in consumer behaviour, ensuring that it remains an accurate measure of inflation as spending patterns evolve.
This dynamic approach enhances the index’s relevance and reliability in capturing the true cost of living.
Using the PCE Price Index for trading
As a forex trader, you can use the PCE Price Index to anticipate potential changes in monetary policy by the Federal Reserve.
The Fed closely monitors the PCE Price Index as part of its dual mandate of maintaining price stability and maximising employment.
If the PCE Price Index shows that inflation is rising above the Fed’s target rate (typically around 2%), it may signal that the central bank will tighten monetary policy by raising interest rates. Conversely, if inflation remains persistently low, the Fed may consider lowering interest rates or implementing other stimulative measures.
Changes in interest rates can have a significant impact on currency and commodity markets. Higher interest rates tend to strengthen a currency, making it more attractive for foreign investors, while lower rates can weaken a currency’s value.
Similarly, changes in interest rates can influence the demand for commodities, as they affect the cost of carrying inventories and the overall level of economic activity.
By closely monitoring the PCE Price Index and its implications for monetary policy, traders can position themselves to take advantage of potential market movements. For example, if the PCE Price Index data suggests that the Fed is likely to raise interest rates, traders may consider going long on the U.S. dollar or shorting commodity positions.
Conclusion
The PCE Price Index is a crucial inflation indicator that provides valuable insights into the Federal Reserve’s monetary policy decisions. By understanding how the index is calculated, its advantages over other measures, and its impact on interest rates and market movements, forex and CFD traders can incorporate this information into their trading strategies.
Staying up-to-date with PCE Price Index data releases and analysing the potential implications for monetary policy can help traders identify potential trading opportunities and manage their risk more effectively. As with any economic indicator, it’s essential to combine the PCE Price Index analysis with other technical and fundamental factors to make informed trading decisions.
Please note that the dividends of the following products will be adjusted accordingly. Index dividends will be executed separately through a balance statement directly to your trading account, and the comment will be in the following format “Div & Product Name & Net Volume ”.
Please refer to the table below for more details:
The above data is for reference only, please refer to the MT4/MT5 software for specific data.
If you’d like more information, please don’t hesitate to contact info@vtmarkets.com.
As part of our commitment to providing the most reliable service to our clients, there will be a server and VT Markets APP upgrade this weekend.
MT4/MT5 Maintenance Hours: June 22nd, 2024 (Saturday) 02:00 – 04:00 and 13:00 – 17:00
VT Markets APP Maintenance: June 22nd, 2024 (Saturday) 00:00 – 04:00 The above time is system time GMT+3.
Please note that the following aspects might be affected during the maintenance:
1. During the MT4/MT5 maintenance period, the price quote and trading management will be temporarily disabled. You will not be able to open new positions, close open positions, or adjust the trades.
2. During the VT Markets APP maintenance period, the login will be temporarily disabled. If you need to trade, apply for deposits, withdrawals, or other account-related applications, it is recommended that you operate through MT4/MT5 and the client portal.
3. There might be a gap between the original price and the price after maintenance. The gaps between Pending Orders, Stop Loss and Take Profit will be filled at the market price once the maintenance is completed. It is suggested that you manage the account properly.
Please refer to the MT4 / MT5 / VT Markets APP for the specific maintenance completion and market opening time.
Thank you for your patience and understanding about this important initiative.
If you’d like more information, please don’t hesitate to contact info@vtmarkets.com.
Please note that the dividends of the following products will be adjusted accordingly. Index dividends will be executed separately through a balance statement directly to your trading account, and the comment will be in the following format “Div & Product Name & Net Volume ”.
Please refer to the table below for more details:
The above data is for reference only, please refer to the MT4/MT5 software for specific data.
If you’d like more information, please don’t hesitate to contact info@vtmarkets.com.