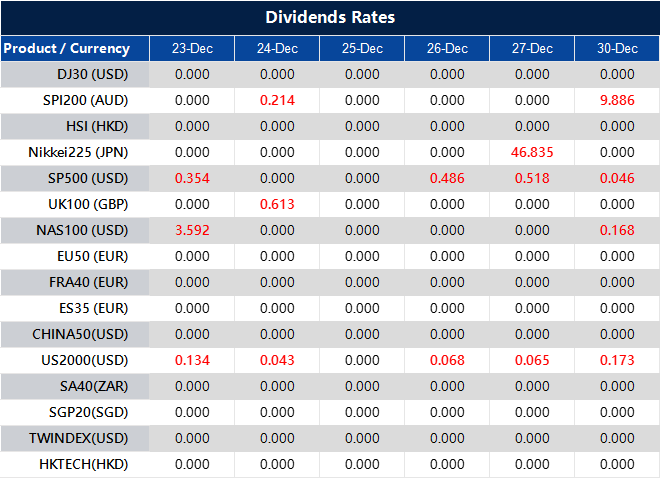
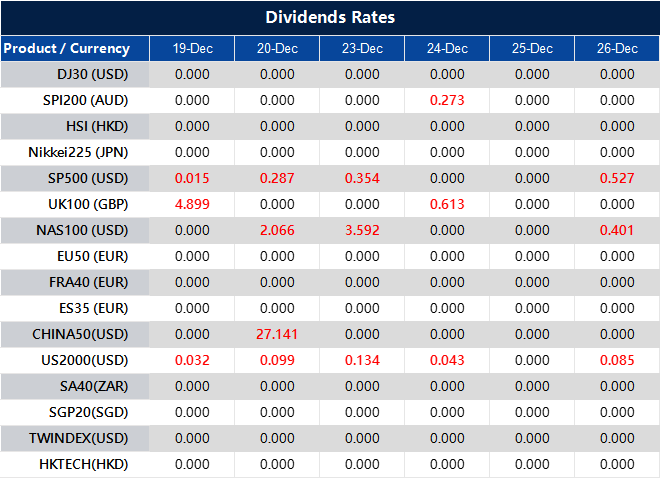
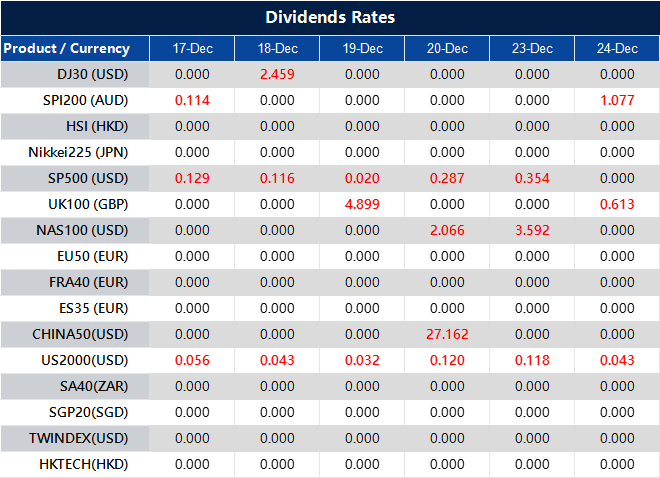
Please note that the dividends of the following products will be adjusted accordingly. Index dividends will be executed separately through a balance statement directly to your trading account, and the comment will be in the following format “Div & Product Name & Net Volume ”.
Please refer to the table below for more details:
The above data is for reference only, please refer to the MT4/MT5 software for specific data.
If you’d like more information, please don’t hesitate to contact info@vtmarkets.com.
Written on December 23, 2024 at 7:49 am, by anakin
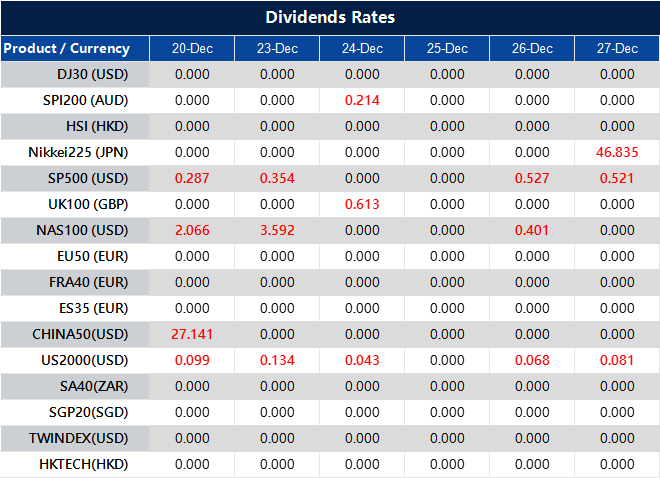
Please note that the dividends of the following products will be adjusted accordingly. Index dividends will be executed separately through a balance statement directly to your trading account, and the comment will be in the following format “Div & Product Name & Net Volume ”.
Please refer to the table below for more details:
The above data is for reference only, please refer to the MT4/MT5 software for specific data.
If you’d like more information, please don’t hesitate to contact info@vtmarkets.com.
Written on December 20, 2024 at 8:18 am, by anakin
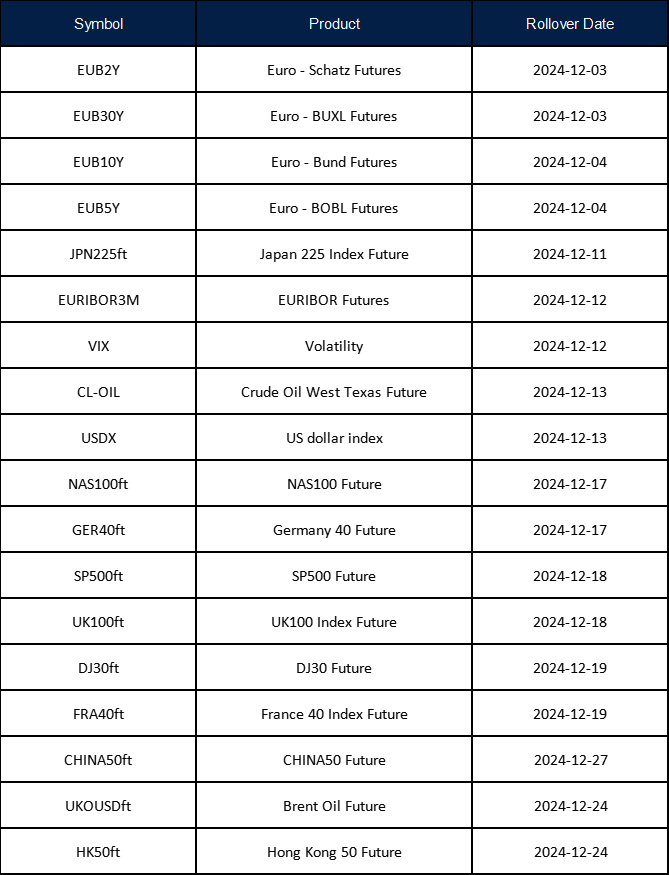
New contracts will automatically be rolled over as follows:
Please note:
• The rollover will be automatic, and any existing open positions will remain open.
• Positions that are open on the expiration date will be adjusted via a rollover charge or credit to reflect the price difference between the expiring and new contracts.
• To avoid CFD rollovers, clients can choose to close any open CFD positions prior to the expiration date.
• Please ensure that all take-profit and stop-loss settings are adjusted before the rollover occurs.
• All internal transfers for accounts under the same name will be prohibited during the first and last 30 minutes of the trading hours on the rollover dates.
If you’d like more information, please don’t hesitate to contact info@vtmarkets.com.
Written on December 20, 2024 at 6:43 am, by anakin
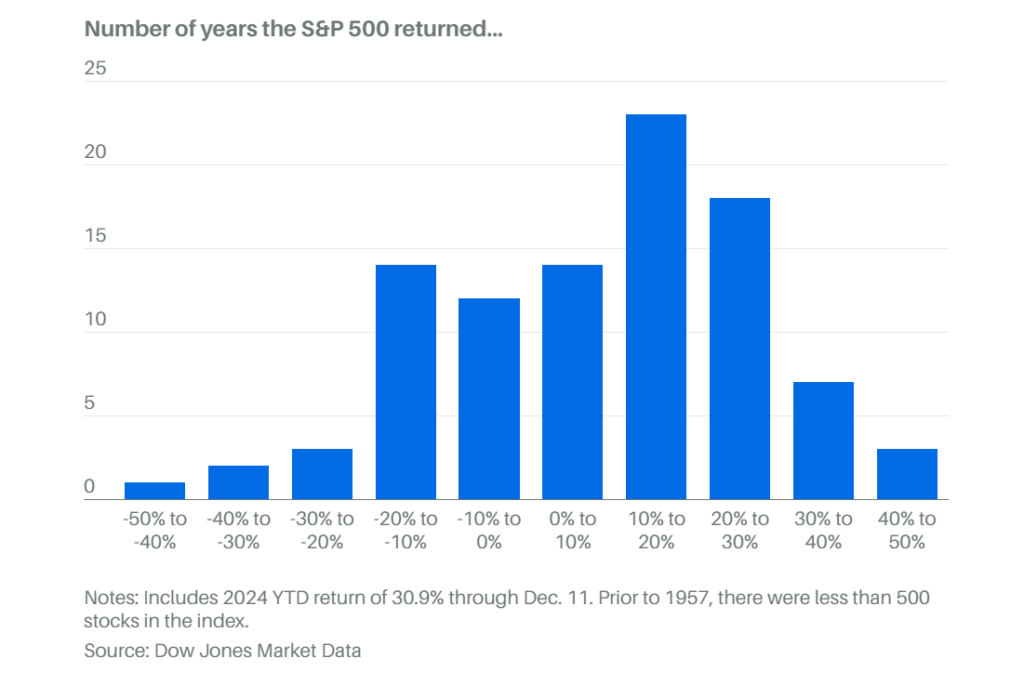
As 2024 draws to a close with remarkable gains—the S&P 500 up 30% and the Nasdaq soaring 35%—investors are naturally wondering what 2025 might bring. With artificial intelligence reshaping industries, interest rates in flux, and a post-election landscape ahead, the coming year promises to be fascinating for market watchers. Whether you are a casual investor or managing your retirement savings, understanding what might lie ahead can help you make more informed decisions.
Looking back to move forward
The market’s journey since 2022 tells an important story. After a challenging 2022 that saw nearly 20% decline due to rising interest rates, markets bounced back impressively with a 24% gain in 2023, followed by 2024’s stellar performance.
This pattern reminds us of a crucial truth: markets move in cycles, alternating between growth and downturns.
However, history suggests we should temper our expectations for 2025. Consecutive years of 20%-plus gains are relatively rare, having occurred only three times in market history. While this doesn’t guarantee a downturn, it suggests we might see more modest returns ahead.
The big picture: What’s driving the market?
The most transformative force shaping markets is artificial intelligence. Much like automobiles in the 1920s revolutionised society, AI is fundamentally changing how businesses operate.
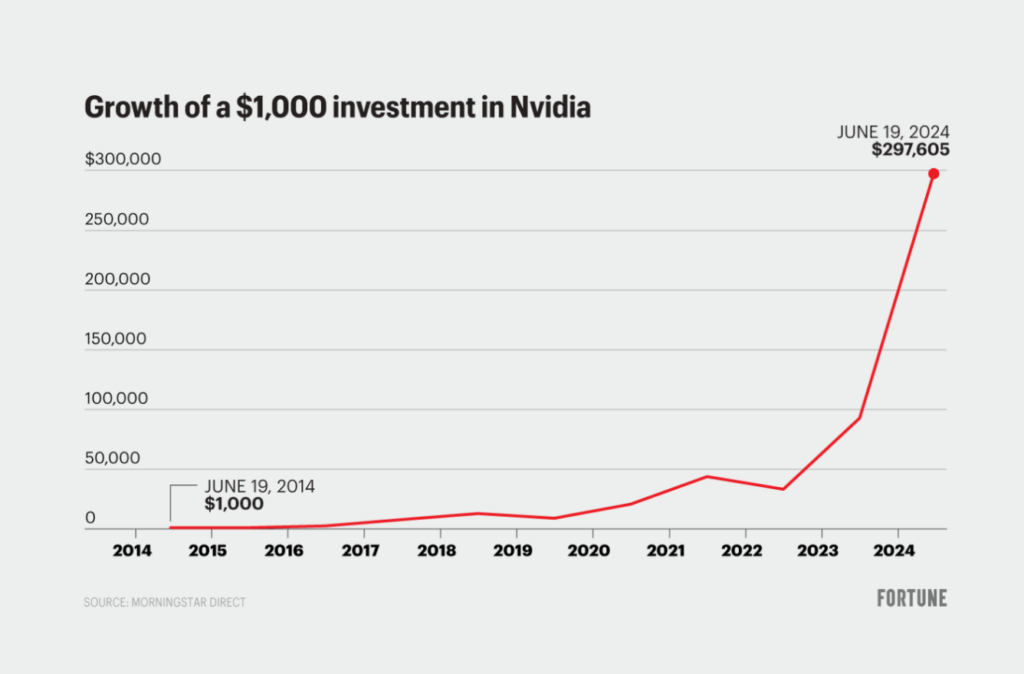
Companies like Nvidia, which saw its stock rise 178% in 2024, exemplify this trend. AI investments are expected to grow at a 29% compound annual growth rate through 2028, creating opportunities across various sectors.
Interest rates and inflation will continue playing crucial roles. After seeing inflation fall below 3% in summer 2024, the Federal Reserve began lowering rates. Analysts expect three more rate cuts in 2025, which typically supports stock prices.
However, the spectre of persistent inflation hasn’t completely vanished, and the Fed’s actions will largely depend on economic data.
Global factors add another layer of complexity. China’s economic challenges might dampen demand for Western exports, while emerging markets in India and Africa show promising growth potential.
These dynamics create a mixed but interesting landscape for international investors.
Numbers in focus
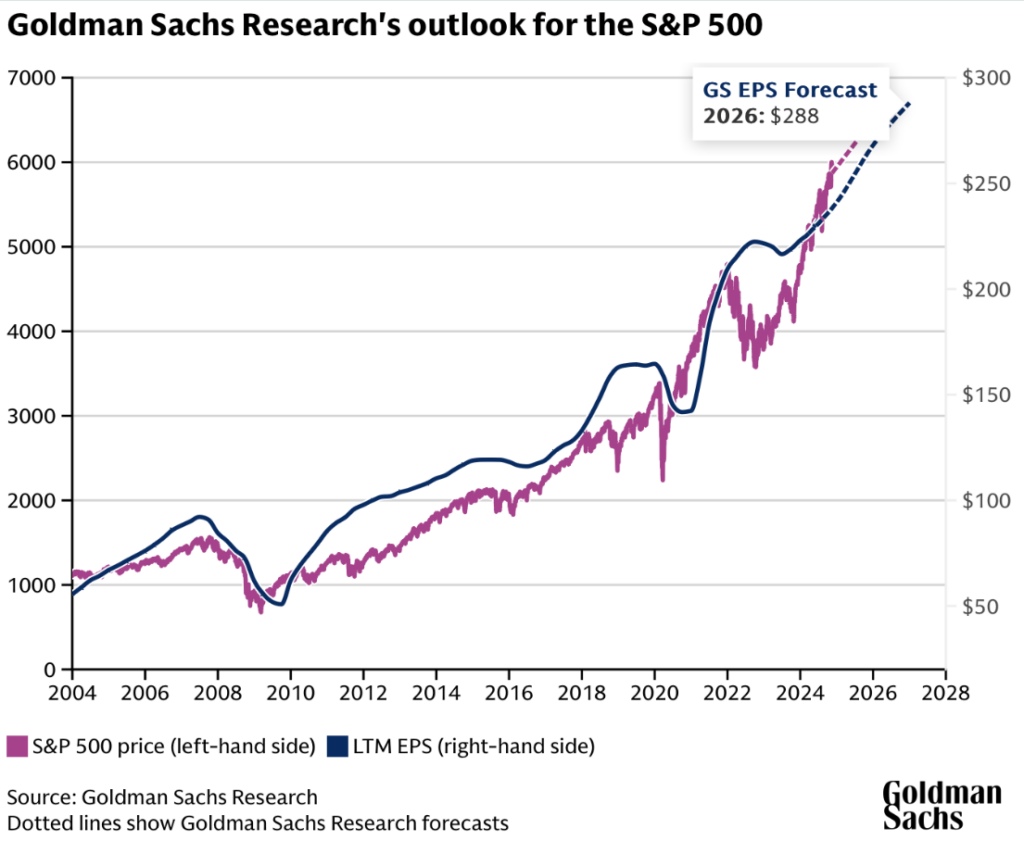
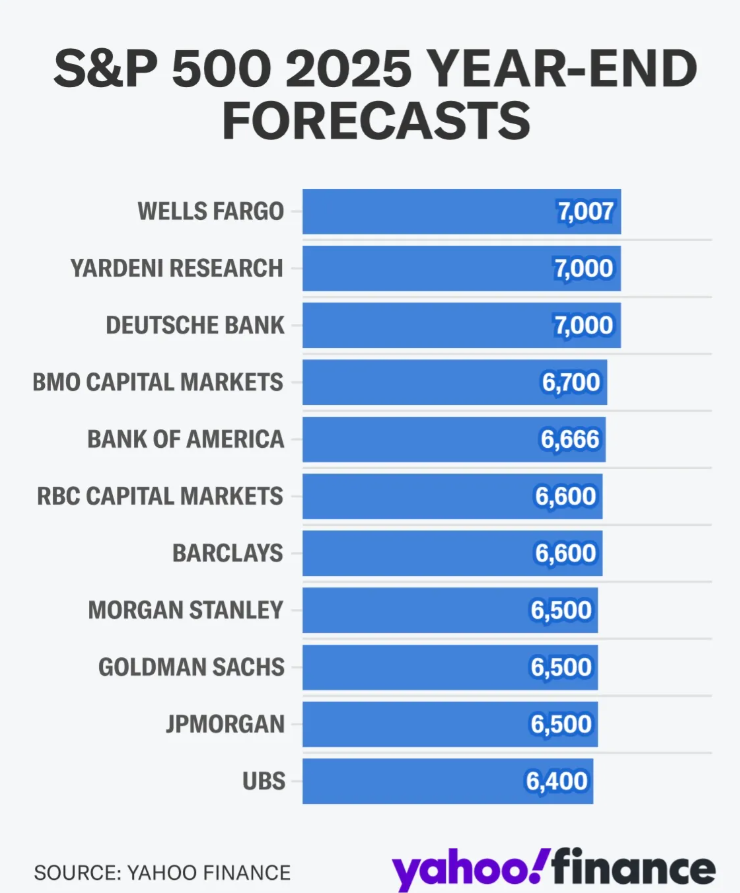
Wall Street strategists offer varying predictions for 2025. Conservative estimates suggest the S&P 500 might end the year between 5,557 (a 5% decline) and 6,435 (a 10% gain). More optimistic forecasts point to 7,000, representing a 20% increase. Morgan Stanley, known for its measured outlook, predicts a 7% rise to around 6,500.
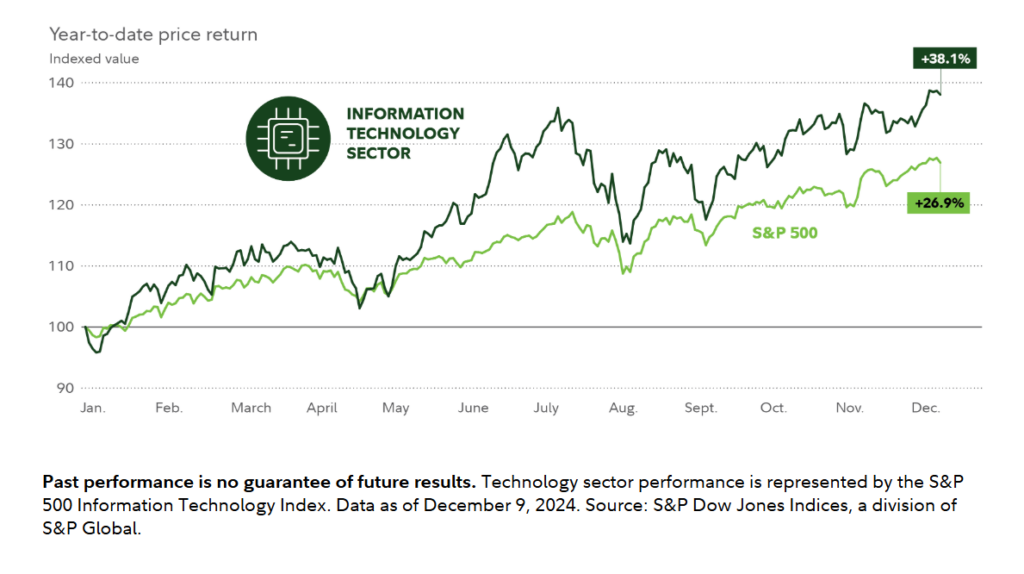
The technology sectorshows particular promise, with AI spending projected to double between 2024 and 2028. This growth isn’t limited to AI—cloud computing, 5G networks, and cybersecurity are all expanding rapidly.
Market leaders in high-performance computing and semiconductor manufacturing are seeing unprecedented demand, particularly from data centres and AI applications.
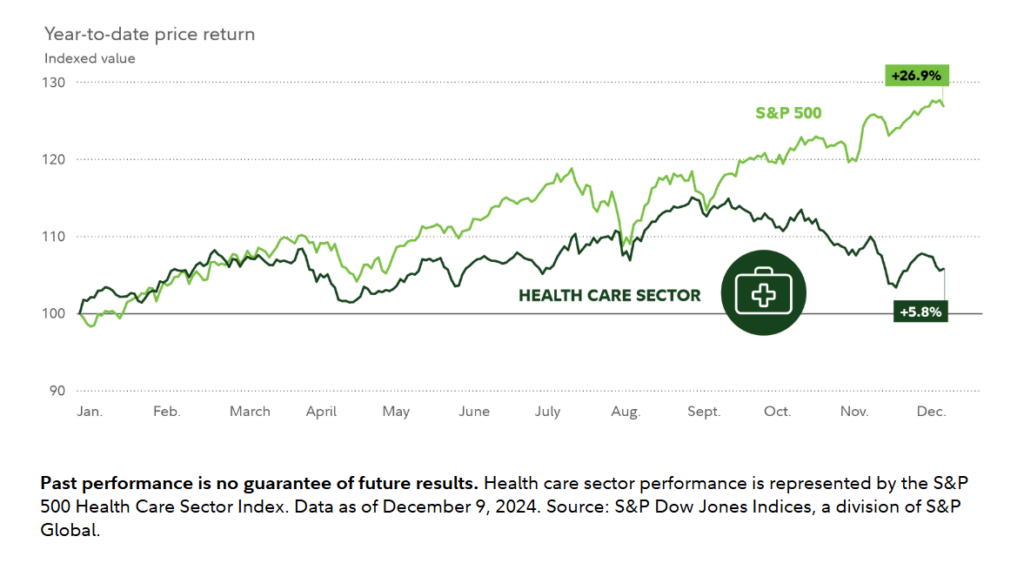
Healthcare’s projected 7% annual growth through 2027 stems from three main factors: improved cost efficiencies through technology adoption, higher reimbursement rates, and new revenue streams from digital health solutions. Companies combining traditional healthcare with technological innovation are especially well-positioned.
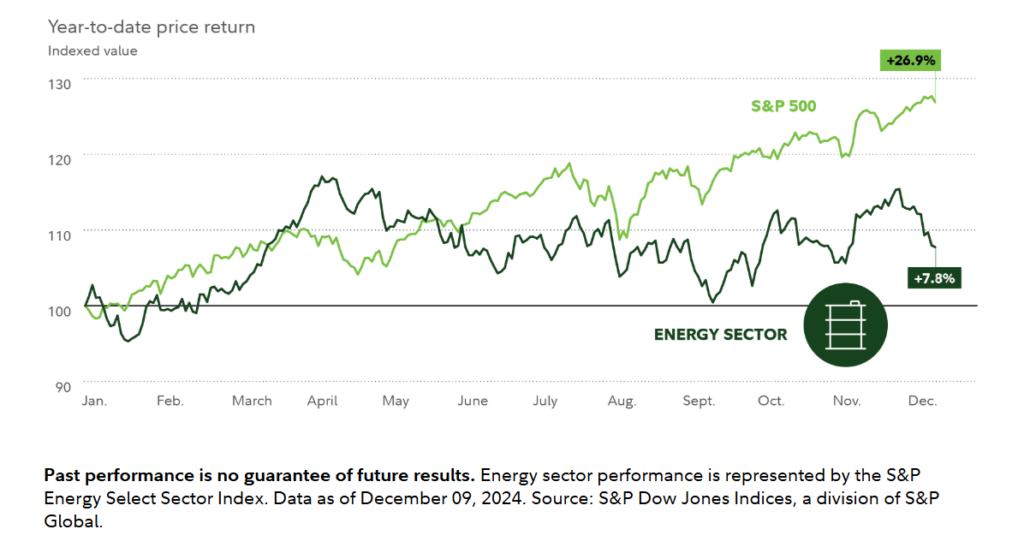
The energy sector offers a balanced opportunity across both traditional and renewable sources. While fossil fuel demand remains strong, driven partly by AI technologies’ power requirements, renewable energy sources are seeing accelerated adoption.
This creates what analysts term a “barbell opportunity”—investors can benefit from both traditional energy stability and green energy growth potential.
These sectors might see additional benefits if interest rates decline in 2025, as lower borrowing costs could fuel further innovation and expansion.
Risk factors to consider
Several potential challenges could impact market performance in 2025.
The aftermath of the US presidential election might bring policy changes affecting trade relationships and corporate regulations. Ongoing geopolitical tensions, including conflicts in Ukraine and the Middle East, could disrupt global trade and commodity supplies.
Market valuations present another concern. The S&P 500’s forward price-to-earnings ratio remains above its 20-year average, suggesting stocks might be relatively expensive. This makes strong corporate earnings growth crucial for sustaining current price levels.
Some analysts, including Peter Berezin, chief global strategist at BCA Research, warn of potential sharp declines, with the S&P 500 possibly dropping to 4,450. While this represents a more pessimistic scenario, it reminds us of the importance of preparing for various outcomes.
Practical tips for everyday investors
Given this complex landscape, how should ordinary investors approach 2025?
First, diversification remains crucial. Consider spreading investments across different sectors and asset classes. The “barbell strategy” suggested by Morgan Stanley—combining both high- and low-risk assets—might be worth considering.
Technology and healthcare sectors offer growth potential, but don’t overlook traditional sectors that might benefit from economic changes. Environmental, Social, and Governance (ESG) investments continue gaining popularity, particularly in renewable energy and sustainable technologies.
For those holding cash or high-yield bonds, consider adjusting your strategy as interest rates decline. However, maintain some defensive positions given the potential for market volatility.
Looking ahead
While 2025 might not match 2024’s exceptional returns, it offers interesting opportunities for patient investors. The continuing AI revolution, changing interest rate environment, and evolving global economy create various paths for potential growth.
Successful investing isn’t about capturing every market move but staying committed to a well-structured strategy aligned with your goals. Markets have consistently rewarded patient investors who maintain discipline through different cycles, whether 2025 brings modest gains or temporary setbacks.
As you navigate the evolving market landscape, ensure your strategy is tailored to your objectives and circumstances. Open a live account with VT Markets today to access the tools and insights that can help you seize opportunities and stay ahead in the journey toward achieving your investment goals.
Written on December 19, 2024 at 1:45 pm, by anakin
Please note that the dividends of the following products will be adjusted accordingly. Index dividends will be executed separately through a balance statement directly to your trading account, and the comment will be in the following format “Div & Product Name & Net Volume ”.
Please refer to the table below for more details:
The above data is for reference only, please refer to the MT4/MT5 software for specific data.
If you’d like more information, please don’t hesitate to contact info@vtmarkets.com.
Written on December 19, 2024 at 9:36 am, by anakin
As part of our commitment to provide the most reliable service to our clients, there will be server maintenance this weekend.
Maintenance Hours:
21th of December 2024 (Saturday) 00:00 – 06:00 (GMT+2)
Please note that the following aspects might be affected during the maintenance:
1. During the maintenance, Client portal will be unavailable, including managing trades, Deposit/Withdrawal and all the other functions will be limited.
2. During the maintenance, the price quote and trading management will be temporarily disabled. You will not be able to open new positions, close open positions, or make any adjustments to the trades.
3. There might be a gap between the original price and the price after maintenance. The gaps between Pending Orders, Stop Loss and Take Profit will be filled at the market price once the maintenance is completed. If you don’t want to hold any open positions during the maintenance, it is suggested to close the position in advance.
Please refer to MT5 for the latest update on the completion and market opening time.
Thank you for your patience and understanding about this important initiative.
If you’d like more information, please don’t hesitate to contact info@vtmarkets.com.
Written on December 19, 2024 at 7:31 am, by anakin
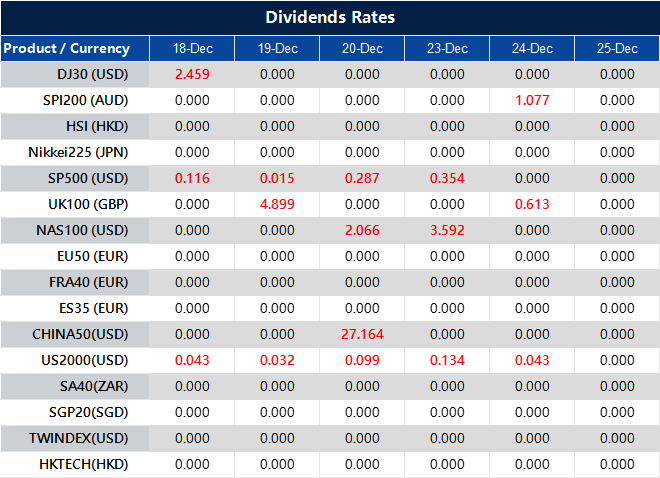
Please note that the dividends of the following products will be adjusted accordingly. Index dividends will be executed separately through a balance statement directly to your trading account, and the comment will be in the following format “Div & Product Name & Net Volume ”.
Please refer to the table below for more details:
The above data is for reference only, please refer to the MT4/MT5 software for specific data.
If you’d like more information, please don’t hesitate to contact info@vtmarkets.com.
Written on December 18, 2024 at 7:31 am, by anakin
To provide a favorable trading environment to our clients, VT Markets will have leverage adjustment for Index products on December 21st, 2024:
Adjustment Details:
1. The floating leverage for Index products will be adjusted to a fixed leverage of 500:1.
2. Index products that already have a fixed leverage of 500:1 will remain unchanged. When a product’s leverage is adjusted from high to low, the margin requirement increases, and the risk of stop-out also increases. The above information is provided for reference only; please refer to the MT4/MT5 software for specific data.
Friendly reminders:
1. All specifications stay the same except leverage.
2. The margin requirement of the trade can be affected by this adjustment. Please make sure the funds in your account are sufficient to hold the position before this adjustment.
If you’d like more information, please don’t hesitate to contact info@vtmarkets.com.
Written on December 17, 2024 at 8:18 am, by anakin
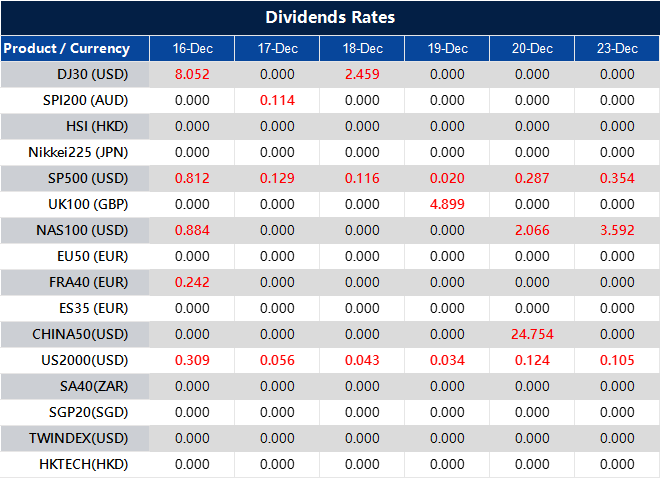
Please note that the dividends of the following products will be adjusted accordingly. Index dividends will be executed separately through a balance statement directly to your trading account, and the comment will be in the following format “Div & Product Name & Net Volume ”.
Please refer to the table below for more details:
The above data is for reference only, please refer to the MT4/MT5 software for specific data.
If you’d like more information, please don’t hesitate to contact info@vtmarkets.com.
Written on December 17, 2024 at 7:24 am, by anakin
Please note that the dividends of the following products will be adjusted accordingly. Index dividends will be executed separately through a balance statement directly to your trading account, and the comment will be in the following format “Div & Product Name & Net Volume ”.
Please refer to the table below for more details:
The above data is for reference only, please refer to the MT4/MT5 software for specific data.
If you’d like more information, please don’t hesitate to contact info@vtmarkets.com.
Written on December 16, 2024 at 7:12 am, by anakin