Back

Unveiling the power of technical analysis: A forex trader’s strategic edge

In ancient Japan, there was a brilliant rice trader named Munehisa Homma. He had a unique talent for predicting future price movements in the rice markets. How did he do it? Well, he closely observed market prices and studied the emotions of fear and greed among traders. This keen observation led him to create something groundbreaking – the candlestick chart. 

Homma’s candlestick chart displayed the open, high, low, and close prices over specific time periods, giving traders a visual representation of price movements. This innovation caught on quickly and spread throughout Japan, revolutionising trading. 

Fast forward to the late 19th century when Charles Dow, a co-founder of Dow Jones & Company and the Wall Street Journal, encountered Japanese candlestick charting. Impressed by its potential, he brought it to the Western world, where it further evolved. 

Over time, Technical Analysis, as it came to be known, saw the addition of the Elliott Wave Theory and benefited greatly from advancements in technology. Traders gained access to sophisticated charting software and a wide range of technical indicators. 

Today, Technical Analysis remains a favoured approach in Forex trading. It allows traders to make informed decisions based on data-driven insights, empowering them to navigate the dynamic and ever-changing markets with confidence. 

Understanding Technical Analysis 

Imagine being a detective, deciphering hidden clues in the financial market to predict its next move. That’s precisely what Technical Analysis does for traders! It’s a fascinating discipline that involves diving into historical market data, with a keen focus on price charts and trading volumes. But wait, there’s more! 

While Fundamental Analysis looks at economic indicators and financial reports, Technical Analysis takes a different route. It operates on the belief that everything you need to know about an asset is already encoded in its price. It’s like the market’s secret language waiting to be decoded. 

Traders who wield Technical Analysis skills study the past price patterns, seeking clues and hints about the future. They are the Sherlock Holmes of the trading world, spotting trends and potential trade opportunities with precision. 

Through this powerful analytical approach, traders get a glimpse into the market’s underlying sentiment. They understand when it’s giddy with optimism, paralysed by fear, or in the grip of uncertainty. Armed with these insights, they make informed decisions about the perfect moment to enter or exit trades. 

So, why does this matter so much? In the fast-paced world of Forex trading, timing is everything. Technical Analysis gives traders the edge they need to navigate through the turbulence of the market, making well-timed moves and staying ahead of the game. It’s no wonder Technical Analysis is a favourite among traders who love the thrill of decoding the market’s mysteries and reaping rewards from their astute predictions. 

Basic Concepts of Technical Analysis 

To navigate the dynamic world of financial markets effectively, traders must grasp the foundational concepts of Technical Analysis. These core principles provide a deeper understanding of market dynamics and empower traders to make well-informed decisions. 

Price Charts 

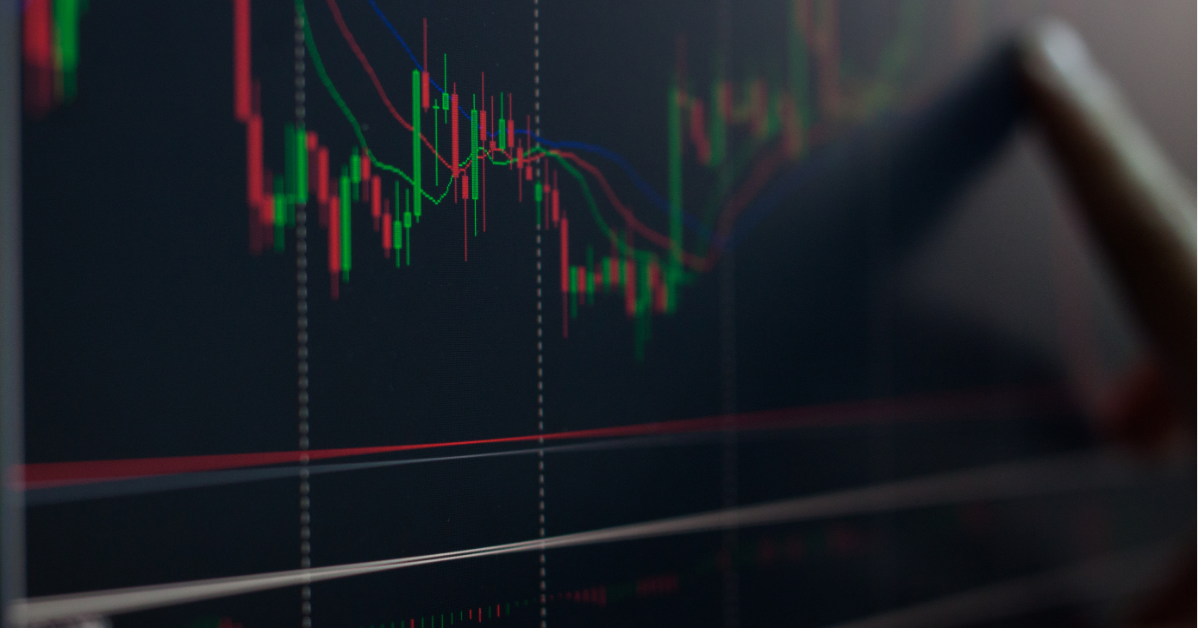
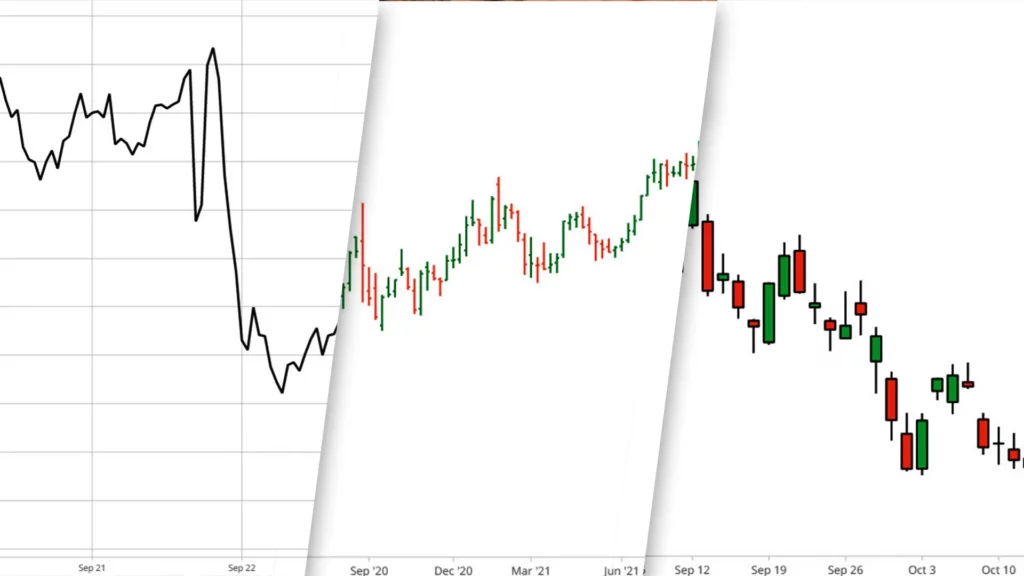
Price charts serve as the bedrock of Technical Analysis, offering a visual representation of historical price movements of currency pairs over specific timeframes. Among the commonly used charts are candlestick and line charts. 

Candlestick charts present a wealth of information, revealing open, high, low, and close prices within a designated timeframe. On the other hand, line charts provide a simplified view, showcasing only the closing prices. Understanding these charts enables traders to spot patterns, trends, and potential turning points in the market. 

source: Britannica Money

Timeframes 

Mastering different timeframes is essential for traders to adapt their strategies to various market conditions. 

Timeframes vary from ultra-short periods, such as seconds or minutes, favoured by intraday traders seeking rapid profit opportunities, to longer-term perspectives like daily or weekly, preferred by investors aiming to capture substantial trends. 

Analysing price action across multiple timeframes offers a comprehensive view of market behaviour, facilitating well-timed entries and exits. 

Support and Resistance 

The concepts of support and resistance levels are invaluable tools for traders seeking to identify crucial price levels in the market. 

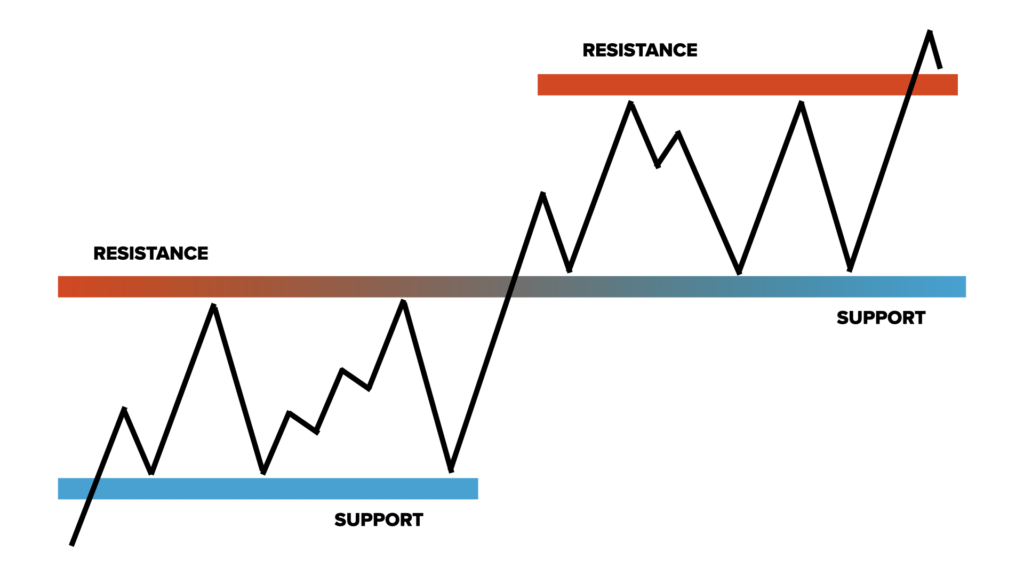
Support refers to price zones where demand is strong enough to halt a downtrend, acting as a price floor. Conversely, resistance denotes areas where supply is abundant enough to prevent an uptrend from continuing, creating a price ceiling. 

Recognising these levels empowers traders to make strategic decisions, such as placing stop-loss and take-profit orders and enables them to anticipate potential trend reversals. 

Trend Lines 

Trend lines are powerful aids in understanding market direction and momentum. By drawing straight lines connecting consecutive peaks or troughs on a price chart, traders gain insights into the prevailing trend – whether it is upward, downward, or sideways. 

Trend lines help traders identify key support and resistance levels, confirm trend strength, and anticipate potential breakout or reversal points. Understanding trend lines enhances traders’ ability to ride trends and capitalise on market opportunities. 

Basic Chart Patterns 

In Technical Analysis, chart patterns play a significant role in providing insights into potential market reversals or continuations. These patterns are recognised for their ability to signal shifts in market sentiment. Let’s explore some common chart patterns that traders frequently encounter: 

Technical Analysis encompasses a variety of chart patterns, each carrying its own unique implications. Some well-known patterns include the Head and Shoulders, Double Tops, Double Bottoms, and Triangles. Understanding these patterns can help traders anticipate potential changes in market direction and identify trading opportunities. 

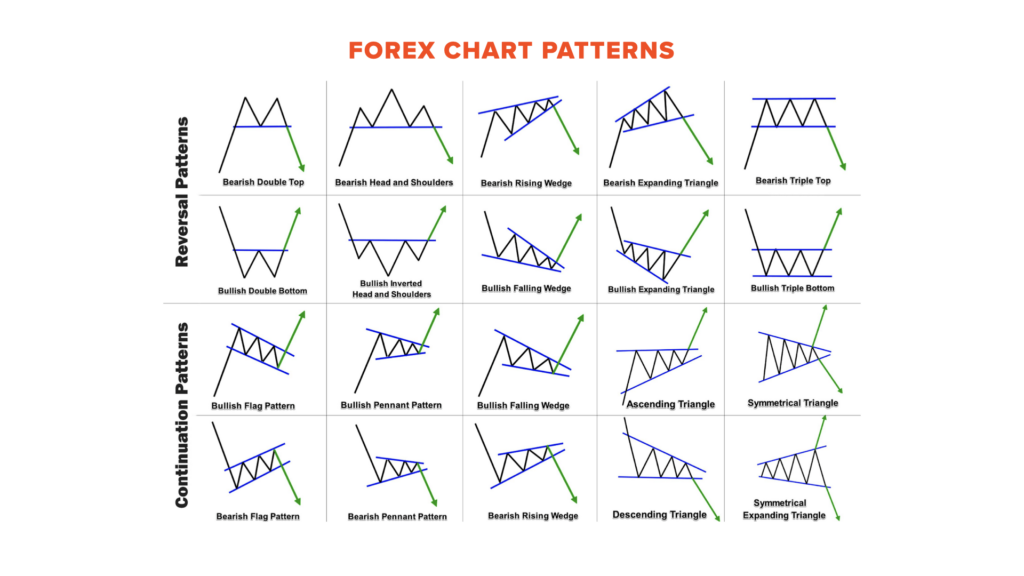
The key to effective trading lies in accurately identifying chart patterns. Each pattern provides important information about the balance between buyers and sellers. By mastering pattern recognition, traders can gain insights into potential price targets and develop informed trading strategies. 

Moreover, chart patterns are often accompanied by volume trends, which can serve as additional confirmation of their validity. Volume, reflecting the number of shares or contracts traded in a given period, can complement pattern analysis and help assess the strength of signals. Integrating both chart patterns and volume analysis empowers traders to make well-considered decisions when executing trades. 

Technical Indicators 

Technical indicators are mathematical calculations derived from price, volume, or open interest data. Their primary purpose is to aid traders in confirming trends, measuring momentum, and identifying potential buy or sell signals. 

source: Britannica Money

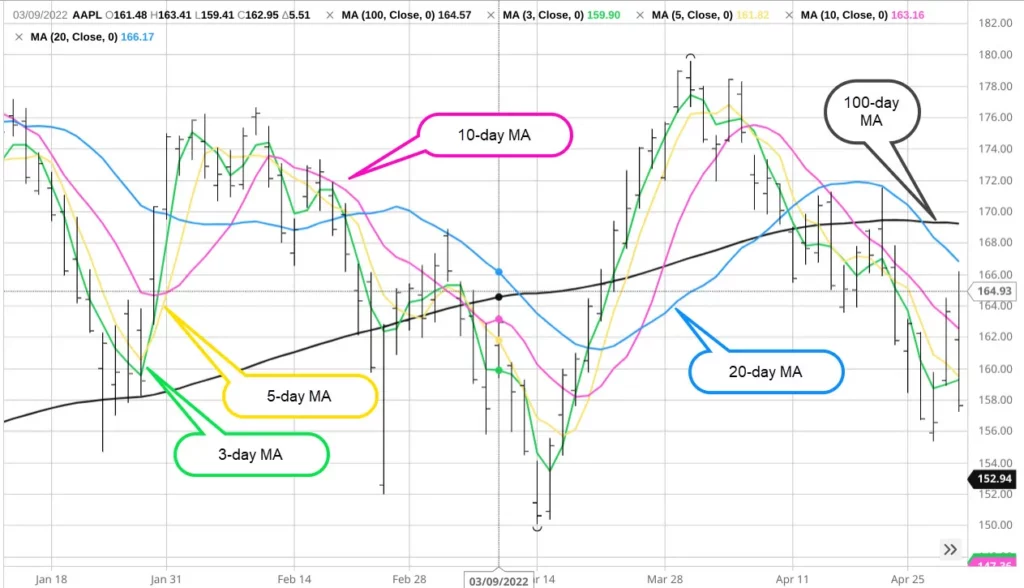
There is an array of technical indicators available to traders, each serving a unique purpose. Moving Averages help smooth out price data and indicate trend direction. The Relative Strength Index (RSI) measures overbought or oversold conditions, while the Moving Average Convergence Divergence (MACD) highlights changes in a trend’s strength and direction. 

Interpreting indicators involves analysing their values in conjunction with price patterns and other relevant market factors. Divergence between an indicator and price movement can also provide valuable insights into potential shifts in market sentiment. 

Pros & Cons of Technical Analysis 

Mastering the art of trading involves understanding the strengths and limitations of various analytical approaches. Technical Analysis, a popular method used by traders worldwide, offers its fair share of advantages and drawbacks. 

Pros: 

  • Accessibility: Technical Analysis is renowned for its accessibility, catering to traders of all experience levels. With a wealth of educational resources available, beginners can quickly grasp its concepts and apply them to their trading endeavours. 
  • Visual Representation: Price charts and technical indicators act as valuable visual aids, providing traders with an intuitive representation of market trends and patterns. The visual nature of Technical Analysis simplifies data interpretation and supports informed decision-making. 
  • Wide Range of Indicators: The diverse selection of technical indicators empowers traders to customise their analyses to adapt to various market conditions and trading styles. This flexibility allows for a more personalised and adaptable approach to trading. 

Cons: 

  • Subjectivity: Technical Analysis entails interpreting patterns and indicators, making it susceptible to subjectivity. Different traders may draw varying conclusions from the same data, leading to a degree of interpretation variance. 
  • Historical Based: Technical Analysis primarily relies on historical price data, which may not fully account for unforeseen events or sudden shifts in market sentiment. As a result, abrupt market changes can challenge the accuracy of technical predictions. 
  • Limited Scope: Relying solely on Technical Analysis might overlook crucial fundamental factors that significantly influence currency movements. Neglecting these fundamental aspects can lead to incomplete market analyses and trading decisions. 

Tips for Using Technical Analysis in Forex Trading 

To leverage Technical Analysis in the Forex market effectively, follow these key tips: 

  • Master the Basics: Understand key concepts like price charts, trend lines, and support/resistance levels. 
  • Combine Indicators: Use a mix of indicators and chart patterns for stronger analysis. 
  • Choose Timeframes Wisely: Select the right timeframe that suits your trading style. 
  • Be Patient and Disciplined: Avoid impulsive decisions and wait for clear signals. 
  • Implement Risk Management: Set stop-loss and take-profit orders to protect your capital. 
  • Stay Informed: Keep an eye on market news and events that may impact your analysis. 
  • Backtest Strategies: Test your strategies on historical data before live trading. 
  • Avoid Overtrading: Stick to your trading plan and avoid excessive trades. 
  • Maintain a Trading Journal: Record your trades and learn from your experiences. 
  • Keep Learning: Stay updated with new developments in Technical Analysis and Forex trading. 

In conclusion, Technical Analysis is an invaluable tool in the world of Forex trading, empowering traders with insights into market trends and potential trading opportunities. By mastering basic concepts, recognising chart patterns, and effectively using technical indicators, traders can make more informed decisions. However, it is crucial to combine Technical Analysis with other analytical methods and apply sound risk management practices to navigate the complexities of Forex trading successfully. 

Dividend Adjustment Notice – August 8, 2023

Dear Client,

Please note that the dividends of the following products will be adjusted accordingly. Index dividends will be executed separately through a balance statement directly to your trading account, and the comment will be in the following format “Div & Product Name & Net Volume ”.

Please refer to the table below for more details:

The above data is for reference only, please refer to the MT4/MT5 software for specific data.

If you’d like more information, please don’t hesitate to contact info@vtmarkets.com.

Dividend Adjustment Notice – August 7, 2023

Dear Client,

Please note that the dividends of the following products will be adjusted accordingly. Index dividends will be executed separately through a balance statement directly to your trading account, and the comment will be in the following format “Div & Product Name & Net Volume ”.

Please refer to the table below for more details:

The above data is for reference only, please refer to the MT4/MT5 software for specific data.

If you’d like more information, please don’t hesitate to contact info@vtmarkets.com.

Week Ahead: All Eyes on US Consumer Price Index and Producer Price Index

Several key market events are expected to influence the financial markets this week. Specifically, the highly awaited US Consumer Price Index and Producer Price Index will be released. In light of these crucial announcements, we advise traders to approach their trading preparations with caution, considering the potential for heightened market volatility. 

Here are some key economic highlights to keep an eye on during the week:

New Zealand Inflation Expectations (9 August 2023)

Inflation expectations in New Zealand declined to 2.79% in Q2 2023 from 3.3% in Q1 2023.

The figures for Q3 2023 will be released on 9 August, with analysts expecting another decrease to 2.5%. 

US Consumer Price Index (10 August 2023)

Consumer prices in the US rose 0.2% month-over-month in June 2023 after a 0.1% increase in the previous month.

Analysts anticipate a 0.2% rise in the figures for July, scheduled for release on 10 August. 

UK Gross Domestic Product (11 August 2023)

The British economy shrank by 0.1% month-over-month in May 2023, following a 0.2% growth rate in April.

The figures for June are set to be released on 11 August, with analysts expecting the country’s GDP to grow by 0.1%. 

US Producer Price Index (11 August 2023) 

Producer prices for final demand in the US edged up 0.1% month-over-month in June 2023, following a 0.4% fall seen in May.

The data for July 2023 will be released on 11 August, with analysts expecting a 0.2% increase.

University of Michigan Consumer Sentiment Index (11 August 2023)

The University of Michigan consumer sentiment for the US was revised lower to 71.6 in July 2023 from a preliminary reading of 72.6. It was the highest reading since October 2021 due to the continued slowdown in inflation along with the stabilisation of labour markets.

Analysts expect a reading of 70.9 in the upcoming set of data, due for release on 11 August.

Dividend Adjustment Notice – August 4, 2023

Dear Client,

Please note that the dividends of the following products will be adjusted accordingly. Index dividends will be executed separately through a balance statement directly to your trading account, and the comment will be in the following format “Div & Product Name & Net Volume ”.

Please refer to the table below for more details:

The above data is for reference only, please refer to the MT4/MT5 software for specific data.

If you’d like more information, please don’t hesitate to contact info@vtmarkets.com.

Dividend Adjustment Notice – August 3, 2023

Dear Client,

Please note that the dividends of the following products will be adjusted accordingly. Index dividends will be executed separately through a balance statement directly to your trading account, and the comment will be in the following format “Div & Product Name & Net Volume ”.

Please refer to the table below for more details:

The above data is for reference only, please refer to the MT4/MT5 software for specific data.

If you’d like more information, please don’t hesitate to contact info@vtmarkets.com.

Dividend Adjustment Notice – August 2, 2023

Dear Client,

Please note that the dividends of the following products will be adjusted accordingly. Index dividends will be executed separately through a balance statement directly to your trading account, and the comment will be in the following format “Div & Product Name & Net Volume ”.

Please refer to the table below for more details:

The above data is for reference only, please refer to the MT4/MT5 software for specific data.

If you’d like more information, please don’t hesitate to contact info@vtmarkets.com.

Dividend Adjustment Notice – August 1, 2023

Dear Client,

Please note that the dividends of the following products will be adjusted accordingly. Index dividends will be executed separately through a balance statement directly to your trading account, and the comment will be in the following format “Div & Product Name & Net Volume ”.

Please refer to the table below for more details:

The above data is for reference only, please refer to the MT4/MT5 software for specific data.

If you’d like more information, please don’t hesitate to contact info@vtmarkets.com.

Dividend Adjustment Notice – July 31, 2023

Dear Client,

Please note that the dividends of the following products will be adjusted accordingly. Index dividends will be executed separately through a balance statement directly to your trading account, and the comment will be in the following format “Div & Product Name & Net Volume ”.

Please refer to the table below for more details:

The above data is for reference only, please refer to the MT4/MT5 software for specific data.

If you’d like more information, please don’t hesitate to contact info@vtmarkets.com.

Margin forex trading: How to harness leverage for financial growth

Imagine you have $1,000 and want to invest in the foreign exchange market, commonly known as Forex. Traditionally, your $1,000 would only allow you to control a small trade size. However, with margin trading, you can now control a much larger position, say $100,000, with just a fraction of your own money. This means that even small fluctuations in currency prices can lead to substantial profits or losses. Welcome to the world of Margin Forex Trading! 

The Basics of Margin Forex Trading 

Margin trading in the Forex market refers to the practice of borrowing funds from your broker to trade larger positions than what your account balance would typically allow. It is important to understand that while margin trading offers the potential for higher returns, it also increases the risk of significant losses. 

In cash trading, you only use the money you have in your account to execute trades. In contrast, margin trading allows you to leverage your positions by using borrowed money from your broker. 

One of the key concepts in margin trading is leverage. Leverage is the ratio between the amount of capital you have and the amount you can control. 

For instance, if your broker offers a leverage of 1:100, you can control a position worth $100 for every $1 of your own money. Leverage can amplify both gains and losses, making it a powerful tool that requires careful use. 

Understanding Margin 

Margin, in the context of Forex trading, refers to the collateral you need to provide to open and maintain a leveraged position. It acts as a security deposit to ensure you can cover potential losses. The margin requirement is usually expressed as a percentage and varies depending on the broker and the currency pair you’re trading. 

For example, with a 2% margin requirement, to control a $100,000 position, you would need to have $2,000 in your account. This means you are leveraging your account 50 times (100,000 / 2,000) to control that position. 

Leverage and Margin – A Powerful Combination 

Leverage and margin are closely related. As mentioned earlier, leverage determines how much you can control relative to your account balance. The higher the leverage, the smaller the margin required to control larger positions. 

However, traders need to be aware that while leverage can lead to significant profits, it also exposes them to more substantial losses. For instance, a 1% price movement in the opposite direction of your trade can lead to a 100% loss of the margin invested. 

How Does Margin Work? 

Let’s delve into how margin is used in Forex trading. When you open a leveraged position, your broker sets aside the required margin from your account balance as collateral. As long as your trade is active, the margin remains tied up. Once you close the trade, the margin is released back to your account, along with any profits or losses. 

To calculate the required margin for a specific trade size, you can use the following formula: 

Margin = (Trade Size * Current Price) / Leverage 

To ensure you fully understand the margin requirements and leverage, let’s calculate them with a real-world example. Suppose you want to control a position of $50,000 on the EUR/USD currency pair with a leverage of 1:50. 

Margin = ($50,000 * 1) / 50 = $1,000 

Margin Calls and Stop-Outs: Protecting Your Investments 

In the exciting world of margin Forex trading, understanding margin calls and stop-outs is essential to safeguarding your investments and ensuring responsible trading practices. These mechanisms act as safety nets provided by brokers to protect traders from potential devastating losses. 

Margin Calls: Your Financial Alarm Bell 

A margin call is a crucial warning signal that occurs when the equity in your trading account falls below the required margin level. In simpler terms, it means that your account balance is no longer sufficient to support the open leveraged positions you have taken. 

Suppose you have a margin trading account with $5,000 and decide to open a leveraged position on the GBP/USD currency pair. The broker offers a leverage of 1:100, meaning you can control $100 for every $1 of your own money. You use your $5,000 to control a position worth $500,000 ($5,000 * 100), relying on the 1:100 leverage. 

Now, imagine that the market moves against your position, causing a loss of $4,800. As a result, your account equity drops to $200 ($5,000 – $4,800), which is now significantly below the required margin to maintain your open position. 

At this point, the broker will issue a margin call, notifying you that you need to add more funds to your account to meet the required margin level. If you fail to top up your account, the broker may automatically close your positions to prevent further losses. 

Stop-Outs: Last Line of Defence 

A stop-out is the next stage if a margin call goes unheeded. When your account equity falls further and reaches the stop-out level, the broker will automatically liquidate your positions to protect your account from going into negative territory. 

To continue with our previous example, let’s assume that despite the margin call, you didn’t deposit additional funds to meet the required margin level. The market continues to move against your position, and the losses worsen. As your account equity drops below the stop-out level, your broker will intervene and close your position automatically to prevent your account from incurring more losses. 

In our example, let’s say the stop-out level is set at 20% of the required margin, which would be $1,000 (20% of $5,000). When your account equity falls to $150 (3% of $5,000), which is below the stop-out level, the broker will execute the stop-out and close your position. 

Understanding the significance of margin calls and stop-outs is vital in maintaining your financial well-being while engaging in margin Forex trading. It is crucial to be vigilant about monitoring your account’s equity and ensuring that you have sufficient funds to support your open positions, especially during periods of high market volatility. 

Opening a Margin Trading Account 

If you’re interested in margin trading, you’ll need to open an account with a reputable Forex broker that offers leverage. For example, you can open a margin trading account with VT Markets, a trusted broker known for its user-friendly platform and up to 500:1 leverage option. 

When opening a live trading account, you’ll typically need to deposit an initial amount of funds, which will serve as your trading capital. 

Pros and Cons of Margin Trading 

Margin Forex trading offers exciting opportunities and potential rewards, but it also comes with inherent risks that traders should be aware of. Let’s examine the pros and cons of engaging in margin trading: 

Pros: 

  • Increased Profit Potential: Leverage allows controlling larger positions with a smaller investment, leading to higher potential profits. 
  • Diversification Opportunities: Traders can spread capital across multiple currency pairs to explore various market opportunities. 
  • Access to Larger Markets: Even small retail traders can access the vast Forex market due to leverage. 
  • Trading Flexibility: Leverage enables adopting different trading strategies based on risk tolerance and market analysis. 
  • Hedging: Margin trading allows using hedging strategies to protect against losses in volatile markets. 

Cons: 

  • High Risk of Losses: Leverage increases the risk of significant losses with small price movements. 
  • Margin Calls and Stop-Outs: Traders need to monitor and maintain sufficient margin levels to avoid forced position closures. 
  • Emotional Challenges: Margin trading can be emotionally taxing, leading to impulsive decisions. 
  • Increased Market Volatility: Leverage magnifies the impact of market volatility on the account balance. 
  • Overtrading: High leverage may tempt traders to overtrade, resulting in higher transaction costs and potential losses. 
Margin Trading Tips for Beginners: Navigating the Forex Market Safely 

Margin trading can be enticing for beginners, but it’s essential to approach it with caution and a solid understanding of the risks involved. Here are some valuable tips to help newcomers navigate the world of margin Forex trading safely and responsibly: 

  • Educate Yourself: Learn about Forex markets, leverage, margin requirements, and risk management. 
  • Start Small: Begin with a small account and low leverage to gain experience. 
  • Practice with Demo Accounts: Use virtual funds to practice before trading with real money. Try a risk-free demo account by VT Markets. 
  • Understand Leverage and Margin: Know how leverage works and calculate margin requirements. 
  • Set Realistic Goals: Aim for steady progress and avoid chasing quick gains. 
  • Use Stop-Loss Orders: Implement stop-loss to limit potential losses. 
  • Avoid Emotional Trading: Stick to your plan and don’t let emotions drive decisions. 
  • Manage Risk: Risk only a small percentage of your capital on each trade. 
  • Stay Informed: Keep up with news and events affecting currency prices. 
  • Avoid Overtrading: Trade with discipline and avoid excessive transactions. 
  • Review Your Strategy: Regularly assess and adapt your trading approach. 
  • Be Prepared for Losses: Accept losses as part of trading and learn from them. 
  • Keep a Trading Journal: Record trades and analyse for insights. 

In conclusion, margin Forex trading offers the potential for substantial profits, but it also carries significant risks. Aspiring traders should approach margin trading with caution and always prioritise continuous learning and risk management. By understanding the concepts of margin, leverage, and risk, you can navigate the Forex market with greater confidence and success. 

Back To Top
server

Witaj 👋

Jak mogę ci pomóc?

Porozmawiaj natychmiast z naszym zespołem

Czat na żywo

Rozpocznij rozmowę na żywo przez...

  • Telegram
    hold Wstrzymane
  • Już wkrótce...

Witaj 👋

Jak mogę ci pomóc?

telegram

Zeskanuj kod QR telefonem, aby rozpocząć czat z nami, lub kliknij tutaj.

Nie masz zainstalowanej aplikacji Telegram ani wersji Desktop? Skorzystaj z Telegram Web .

QR code