Forex vs Actions : Les différences clés que tout trader doit connaître
En matière d’investissement, deux des marchés les plus populaires sont le forex marché et les actions traditionnelles. Bien que ces deux options offrent des opportunités pour faire croître son patrimoine, elles s’adressent à des investisseurs aux profils variés et comportent leurs propres avantages et défis. Cet article explore en détail les distinctions entre le forex marché et les actions, leurs mécanismes de trading action, ainsi que les critères pour choisir celui qui convient le mieux à vos objectifs financiers.
Qu’est-ce que le Trading Forex ?
Le trading forex consiste à échanger une devise contre une autre sur le marché mondial des devises, qui fonctionne 24 heures sur 24, cinq jours par semaine, avec plus de 6,6 billions de dollars échangés quotidiennement. Les traders profitent en spéculant sur les fluctuations des paires de devises, telles que l’EUR/USD, influencées par des facteurs comme les données économiques et les événements géopolitiques. Le forex marché offre une haute liquidité, permettant un trading action fluide avec un slippage minimal, même pour des volumes importants. Son accessibilité 24 heures sur 24 permet aux traders de s’engager à tout moment, notamment lors du chevauchement des sessions de Londres et de New York. De plus, le forex propose un effet de levier, permettant aux traders de contrôler des positions importantes avec un capital minimal, amplifiant ainsi les gains et les risques potentiels.
Découvrez ce qu’est le trading forex et comment il fonctionne.
Qu’est-ce que le Trading d’Actions ?
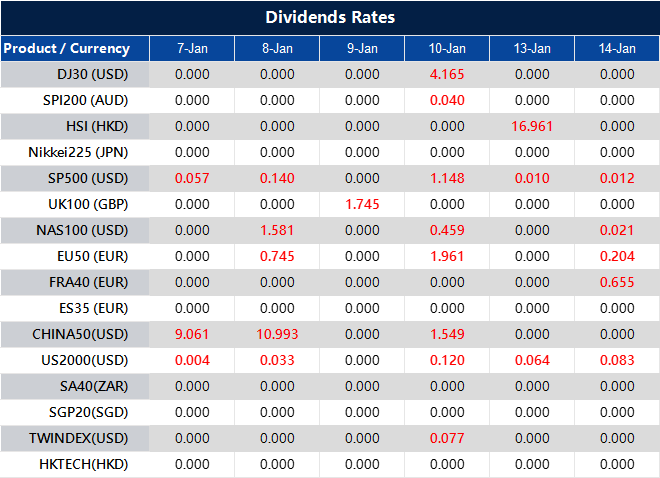
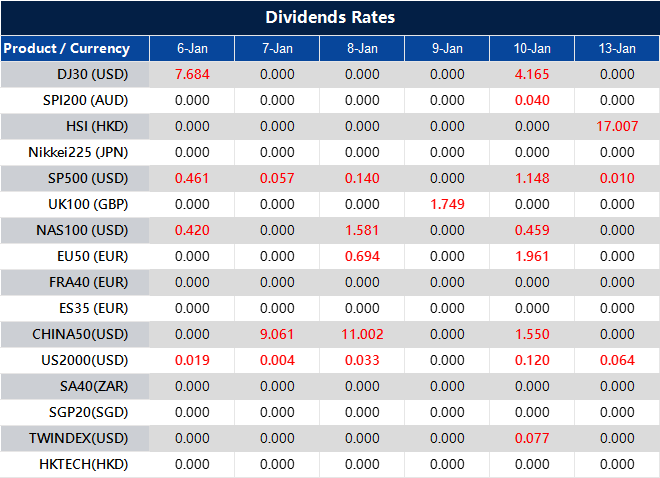
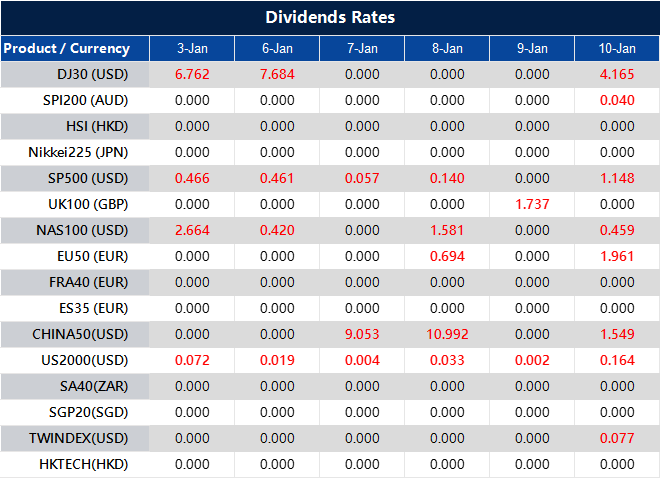
Le trading action consiste à acheter et vendre des parts d’entreprises sur des bourses comme le NYSE ou le NASDAQ. Les investisseurs cherchent à réaliser des bénéfices grâce à l’appréciation des prix et aux dividendes, tout en participant à un marché influencé par les performances des entreprises et les conditions économiques générales. Le trading action offre une propriété partielle dans une entreprise, incluant des droits de vote et l’accès aux paiements de dividendes pour les entreprises rentables. C’est une option idéale pour la construction de richesse à long terme, car les actions offrent généralement une croissance régulière sur plusieurs décennies. Contrairement au forex marché, les prix des actions sont généralement plus prévisibles, étant influencés par des facteurs spécifiques à l’entreprise, tels que les rapports sur les bénéfices, les lancements de produits et le sentiment du marché, ce qui en fait une option plus stable pour les investisseurs.
Découvrez les 10 plus grandes bourses du monde.
Forex vs Actions : Principales Différences Entre le Trading Forex et le Trading d’Actions
Comprendre les distinctions entre le forex marché et les actions est essentiel pour choisir le marché qui correspond à vos objectifs financiers. Voici quelques-unes des principales différences :
1. Taille du Marché et Liquidité
Forex : Le forex marché est le plus grand marché financier au monde, avec un volume d’échanges quotidien dépassant les 6,6 billions de dollars. Cette taille immense garantit qu’il y a toujours une contrepartie disponible pour vos transactions, ce qui le rend extrêmement liquide. Par exemple, si vous tradez l’EUR/USD, vous pouvez presque toujours acheter ou vendre instantanément, sans vous soucier de trouver un acheteur ou un vendeur. Une liquidité élevée entraîne également des écarts plus serrés, réduisant ainsi les coûts de transaction pour les traders. Cela rend le trading action sur le forex particulièrement attrayant pour les scalpeurs et les traders à haute fréquence qui dépendent d’entrées et de sorties rapides.
Actions : Le marché des actions, bien que significatif, est beaucoup plus petit comparé au forex. La liquidité dans le trading action d’actions varie considérablement selon l’action échangée. Les blue-chip stocks comme Apple ou Microsoft disposent généralement d’une liquidité élevée grâce à leur popularité, mais les actions à faible capitalisation peuvent manquer de la même facilité d’achat ou de vente. Une faible liquidité pour certaines actions peut entraîner des écarts plus larges entre l’offre et la demande, ce qui rend leur négociation plus coûteuse.
2. Heures de Trading
Forex : Le forex marché fonctionne 24 heures sur 24, cinq jours par semaine, ce qui le rend accessible aux traders de différents fuseaux horaires. Il est divisé en quatre principales sessions de trading : la session de Sydney, la session de Tokyo, la session de Londres et la session de New York. Par exemple, lorsque les sessions de Londres et de New York se chevauchent, le marché connaît une activité et une liquidité maximales. Ce cycle de 24 heures permet aux traders de réagir immédiatement aux nouvelles et aux événements influençant les prix des devises, offrant ainsi une grande flexibilité, notamment pour ceux ayant des horaires variés.
Actions : Les marchés d’actions ont des horaires de trading fixes selon la région. Par exemple, la Bourse de New York (NYSE) est ouverte de 9 h 30 à 16 h 00 heure de l’Est. En dehors de ces heures, les investisseurs peuvent participer au pré-marché ou au post-marché, mais la liquidité est souvent plus faible, et les prix peuvent être plus volatils. Ces horaires limités signifient que les traders d’actions ne peuvent pas toujours réagir aux nouvelles de dernière minute ou aux événements mondiaux avant la réouverture du marché, ce qui peut entraîner des écarts de prix importants.
3. Volatilité et Risque
Forex : Le forex marché est réputé pour sa forte volatilité, ce qui peut générer des opportunités de profit importantes mais aussi des risques considérables. Les valeurs des devises fluctuent en fonction des événements géopolitiques, des politiques des banques centrales, des publications de données économiques et du sentiment du marché. Par exemple, une hausse des taux d’intérêt par la Réserve fédérale peut entraîner une augmentation du USD par rapport à d’autres devises. Bien que cette volatilité attire les scalpeurs et les day traders, elle implique également que des mouvements soudains du marché peuvent provoquer des pertes importantes pour les traders non préparés.
Actions : Les prix des actions sont généralement moins volatils que les paires de devises du forex marché, bien qu’ils puissent connaître des variations importantes en raison d’événements spécifiques à une entreprise, tels que les rapports sur les bénéfices, les fusions ou les lancements de nouveaux produits. Par exemple, si une entreprise dépasse les attentes en matière de bénéfices, le prix de son action peut monter en flèche, tandis qu’une mauvaise performance peut entraîner une baisse marquée. Cette volatilité relativement plus faible peut être bénéfique pour les investisseurs à long terme qui recherchent une croissance stable plutôt que des gains rapides.
4. Effet de Levier
Forex : L’effet de levier est une caractéristique clé du trading action sur le forex marché, permettant aux traders de contrôler des positions importantes avec un faible capital. Par exemple, un ratio de levier de 1:500 signifie qu’avec 1 000 $ dans votre compte de trading, vous pouvez contrôler une position d’une valeur de 500 000 $. Cela amplifie les gains potentiels mais augmente également le risque de pertes importantes. Par exemple, un mouvement de prix de 1 % sur une position de 500 000 $ équivaut à un gain ou une perte de 5 000 $, soulignant l’importance d’une gestion rigoureuse des risques.
Actions : L’effet de levier dans le trading action des actions est généralement proposé via des comptes sur marge, mais il est beaucoup plus limité par rapport au forex marché. Aux États-Unis, par exemple, les courtiers peuvent offrir un ratio de levier de 2:1 pour les actions, ce qui signifie que vous pouvez emprunter des fonds équivalents à votre capital investi pour augmenter votre pouvoir d’achat. Bien que le trading sur marge puisse améliorer les profits, le levier limité signifie que les traders d’actions sont moins exposés aux risques élevés associés au levier important offert dans le trading action sur le forex.
Découvrez comment débuter en trading pour les débutants.
Avantages et Inconvénients du Trading Forex et du Trading d’Actions
Le trading action sur le forex marché et celui des actions offrent des opportunités uniques aux investisseurs, adaptés à différents styles de trading, appétits pour le risque et objectifs financiers. Pour choisir le bon marché, il est essentiel de comprendre leurs avantages et leurs défis respectifs.
Avantages du Trading Forex
Haute Liquidité : Le forex marché offre une liquidité inégalée grâce à sa taille considérable, avec des volumes d’échanges quotidiens dépassant les 6,6 billions de dollars. Cela garantit que les transactions peuvent être exécutées presque instantanément, même pour de gros volumes. Une liquidité élevée entraîne également des écarts entre l’offre et la demande plus serrés, réduisant les coûts de trading action. Par exemple, des paires de devises comme EUR/USD ou USD/JPY présentent souvent des spreads aussi bas que 0,1 pip.
Découvrez les 8 paires de devises les plus échangées au monde.
Trading 24 Heures sur 24 : Les marchés forex fonctionnent 24 heures sur 24, cinq jours par semaine, ce qui les rend accessibles aux traders du monde entier. Cet horaire permet aux traders de réagir aux événements géopolitiques, aux données économiques ou aux dernières actualités à tout moment. Par exemple, si un événement économique majeur survient en Asie, les traders en Europe ou en Amérique peuvent répondre immédiatement, contrairement aux heures limitées des marchés d’actions.
Opportunités de Levier : Les courtiers forex offrent des ratios de levier élevés, souvent jusqu’à 1:500, permettant aux traders de contrôler de grandes positions avec un capital minimal. Par exemple, avec un dépôt de 1 000 $, un trader peut ouvrir des positions d’une valeur de 500 000 $. Cela amplifie le potentiel de profit, mais augmente également les risques, faisant du levier une arme à double tranchant.
Découvrez si le trading action sur le forex est rentable.
Inconvénients du Trading Forex
Forte Volatilité et Risque : Le forex marché est extrêmement volatile, les paires de devises subissant fréquemment des variations de prix importantes en raison de données macroéconomiques, de développements géopolitiques ou d’interventions des banques centrales. Par exemple, des hausses de taux d’intérêt imprévues peuvent entraîner des mouvements brusques du USD ou de l’EUR, générant des gains ou des pertes significatifs en quelques minutes.
Courbe d’Apprentissage Abrupte : Le trading action sur le forex nécessite une compréhension approfondie des indicateurs économiques mondiaux, de l’analyse technique et des stratégies de gestion des risques. Les débutants peuvent trouver cette complexité intimidante, en particulier lorsqu’ils sont confrontés à des concepts tels que l’effet de levier, les appels de marge et les corrélations entre devises.
Risques Élevés de Levier : Bien que l’effet de levier augmente le potentiel de profit, il amplifie également les pertes. Un petit mouvement défavorable peut rapidement anéantir le capital d’un trader. Par exemple, avec un levier de 1:500, un mouvement de prix défavorable de 0,2 % pourrait entraîner une perte totale de l’investissement initial, soulignant l’importance cruciale d’une gestion des risques rigoureuse.
Avantages du Trading d’Actions
Potentiel de Croissance à Long Terme : Investir dans les actions offre l’opportunité d’une appréciation du capital à long terme. Historiquement, des indices comme le S&P 500 ont généré des rendements annuels moyens de 7 à 10 % sur plusieurs décennies, ce qui rend les actions attrayantes pour construire un patrimoine. Par exemple, un investissement dans Apple ou Amazon il y a dix ans aurait produit des rendements substantiels.
Propriété dans des Entreprises : Les actionnaires possèdent une partie des entreprises dans lesquelles ils investissent, leur accordant des droits de vote et une part des bénéfices de l’entreprise. Cela offre un sentiment de participation et la possibilité de recevoir des dividendes. Par exemple, des entreprises comme Coca-Cola ou Johnson & Johnson sont connues pour verser des dividendes réguliers, générant un revenu passif pour les investisseurs.
Stabilité et Prévisibilité : Les actions ont tendance à afficher des modèles de croissance à long terme plus prévisibles comparés à la forte volatilité du forex marché. Les investisseurs peuvent utiliser l’analyse fondamentale, telle que l’évaluation des bénéfices d’une entreprise ou les tendances sectorielles, pour prendre des décisions éclairées.
Inconvénients du Trading d’Actions
Heures de Trading Limitées : Les marchés d’actions fonctionnent pendant des heures fixes, comme de 9 h 30 à 16 h 00 (heure de l’Est) pour le NYSE. Cela peut être restrictif pour les traders, car des nouvelles susceptibles d’impacter les marchés en dehors de ces horaires peuvent entraîner des écarts de prix lorsque le marché rouvre, limitant ainsi les opportunités d’agir rapidement.
Mouvements du Marché Plus Lents : Comparé au forex marché, les actions affichent généralement des mouvements de prix plus lents, en particulier pour les entreprises établies. Cela peut réduire le potentiel de profit pour les day traders ou les scalpeurs, qui prospèrent grâce à des variations de prix rapides et significatives.
Exigences de Capital Plus Élevées : Contrairement au trading action sur le forex, où l’effet de levier permet à un petit capital de contrôler de grandes positions, le trading d’actions nécessite souvent un investissement initial plus important pour obtenir des rendements significatifs. Par exemple, acheter 10 actions d’une entreprise à 500 $ l’unité nécessiterait 5 000 $, ce qui peut être inaccessible pour certains traders particuliers.
Facteurs à Considérer Lors du Choix Entre Forex et Actions
Lorsque vous décidez entre le forex marché et les actions, plusieurs facteurs entrent en jeu. Chaque marché possède des caractéristiques uniques qui s’alignent différemment avec la tolérance au risque, les objectifs financiers et le style de trading action de chaque individu. Voici cinq facteurs clés à considérer, expliqués en détail :
| Facteur | Trading Forex | Trading Actions |
| Appétit pour le risque | Forte volatilité et risques liés au levier | Faible volatilité, idéal pour les investisseurs averses au risque |
| Objectifs d’investissement | Trading à Court Terme | Croissance à long terme et dividendes |
| Connaissances du marché | Nécessite une expertise approfondie en économie mondiale. | Axé sur les entreprises individuelles |
| Heures de trading | Marché mondial 24h/24, 5j/7 | Limité aux heures des bourses |
| Exigences de capital | Faible capital initial grâce au levier | Investissement initial plus élevé nécessaire |
1. Appétit pour le Risque
Forex : Le trading action sur le forex marché est caractérisé par une forte volatilité et l’utilisation de l’effet de levier, ce qui en fait un choix adapté aux traders ayant une tolérance au risque élevée. Par exemple, des paires de devises comme GBP/USD ou EUR/USD peuvent connaître des mouvements de prix importants en quelques minutes, offrant à la fois des opportunités et des risques. L’effet de levier amplifie ces risques : un petit mouvement de prix peut entraîner des gains ou des pertes significatifs.
Découvrez quelles sont les principales paires de devises.
Actions : Le trading action sur les actions est généralement moins volatil, en particulier lorsqu’il s’agit d’investir dans des entreprises de premier ordre ayant une croissance stable. Bien que les actions individuelles puissent encore connaître des fluctuations importantes en raison des rapports sur les bénéfices ou des actualités du marché, le risque global est généralement plus faible comparé au forex marché. Pour les investisseurs averses au risque, les actions sont souvent le choix privilégié pour une croissance régulière.
2. Objectifs d’Investissement
Forex : Le trading action sur le forex marché est généralement privilégié par les traders à court terme, notamment les day traders et les scalpeurs, qui cherchent à tirer profit des fluctuations rapides des prix. Le fonctionnement 24 heures sur 24 du marché et sa haute liquidité en font une option idéale pour les stratégies de trading fréquentes. Cependant, le forex convient moins aux investissements à long terme, car les devises n’ont pas de croissance intrinsèque comme les actions.
Découvrez les 9 meilleures stratégies et techniques de trading forex.
Actions : Les actions conviennent particulièrement aux investisseurs à long terme recherchant une appréciation du capital ou des revenus de dividendes. Par exemple, investir dans des entreprises comme Apple ou Johnson & Johnson peut offrir des rendements réguliers sur plusieurs décennies. Les actionnaires bénéficient également de la croissance composée, où les dividendes réinvestis et l’appréciation des prix génèrent une accumulation significative de richesse.
Découvrez la différence entre le trading et l’investissement.
3. Connaissances du Marché
Forex : Réussir dans le trading action sur le forex marché nécessite une compréhension approfondie des facteurs macroéconomiques mondiaux, tels que les taux d’intérêt, les données du PIB et les événements géopolitiques. Les traders doivent suivre de près les politiques des banques centrales et les actualités internationales, car ces éléments peuvent entraîner des fluctuations rapides du marché. Les débutants peuvent trouver cela accablant sans une éducation et une expérience adéquates.
Apprenez à trader le forex pour les débutants.
Actions : Le trading action sur les actions implique de comprendre les entreprises individuelles, les industries et les tendances générales du marché. L’analyse fondamentale, comme l’évaluation des états financiers, et l’analyse technique sont des outils clés pour évaluer les actions. Bien que la courbe d’apprentissage pour les actions puisse également être exigeante, l’accent mis sur des facteurs spécifiques à l’entreprise peut être plus accessible pour certains investisseurs par rapport à la portée mondiale du forex marché.
4. Heures de Trading
Forex : Le forex marché fonctionne 24 heures sur 24, 5 jours sur 7, avec des transactions continues sur les marchés mondiaux. Cela offre une flexibilité aux traders dans différents fuseaux horaires et permet de réagir immédiatement aux événements influençant le marché. Par exemple, un trader en Asie peut tirer parti des opportunités lors de la session de Tokyo, tandis qu’un trader aux États-Unis peut se concentrer sur la session de New York.
Actions : Le trading action sur les actions est limité aux horaires d’ouverture des bourses. Par exemple, le NYSE fonctionne de 9 h 30 à 16 h 00 (heure de l’Est), ce qui restreint les opportunités de trading. Bien que des sessions de pré-marché et de post-marché soient disponibles, ces périodes ont une liquidité plus faible et une volatilité accrue, ce qui les rend moins favorables pour de nombreux traders.
5. Exigences de Capital
Forex : Le trading action sur le forex marché nécessite souvent un capital initial plus faible grâce à l’effet de levier. Par exemple, avec un ratio de levier de 1:100, un trader peut contrôler une position de 10 000 $ avec seulement 100 $. Cela rend le forex plus accessible aux traders disposant de petits comptes, bien que cela augmente également le risque de pertes importantes.
Actions : Le trading action sur les actions nécessite généralement un investissement initial plus important, en particulier pour les actions de grande valeur. Par exemple, l’achat de 10 actions à 500 $ l’unité nécessite 5 000 $, ce qui peut être hors de portée pour certains investisseurs particuliers. Bien que les comptes sur marge puissent offrir un levier, il est généralement beaucoup plus faible que celui proposé sur le forex marché.
Conclusion
Lorsqu’il s’agit de choisir entre le trading action sur le forex marché et celui des actions, il est essentiel de comprendre leurs caractéristiques uniques et de les aligner sur vos objectifs financiers, votre tolérance au risque et votre style de trading. Le trading action sur le forex offre une liquidité inégalée, un accès au marché 24h/24, 5j/7, et un effet de levier élevé, ce qui le rend adapté aux traders recherchant des opportunités à court terme et des conditions de marché dynamiques. En revanche, le trading action sur les actions procure une stabilité, un potentiel de croissance à long terme et la possibilité de percevoir des dividendes, ce qui en fait un excellent choix pour ceux qui se concentrent sur la création de richesse au fil du temps. En analysant les avantages et les inconvénients de chaque marché, vous pourrez prendre une décision éclairée et adapter votre stratégie de trading en conséquence.
Commencez Votre Parcours de Trading avec VT Markets
Que vous soyez attiré par le monde dynamique du forex marché ou la stabilité du trading action sur les actions, VT Markets offre la plateforme idéale pour débuter votre parcours. Avec MetaTrader 4 (MT4), MetaTrader 5 (MT5), des outils de trading avancés, une interface conviviale et un accès aux deux marchés, VT Markets vous permet de trader en toute confiance et avec précision.
Ouvrez votre compte de trading en direct dès aujourd’hui evec VT Markets et découvrez un environnement de trading fluide conçu pour vous aider à atteindre vos aspirations financières.
Questions fréquemment posées (FAQ)
1. Quelle est la principale différence entre le forex et les actions ?
Le trading forex consiste à échanger des paires de devises, tandis que le trading d’actions se concentre sur l’achat et la vente de parts d’entreprises. Chaque marché offre une liquidité, une volatilité et des stratégies de trading différentes.
2. Le trading forex est-il plus risqué que le trading d’actions ?
Les deux marchés comportent des risques. Le forex tend à offrir un effet de levier plus élevé et des mouvements de prix plus rapides, tandis que le trading d’actions peut comporter des risques spécifiques à l’entreprise et une volatilité liée aux résultats financiers.
3. Quel est le meilleur marché pour les traders : forex ou actions ?
Cela dépend de vos objectifs de trading. Le forex propose un trading 24 heures sur 24 et une forte liquidité, tandis que les actions conviennent mieux à ceux qui recherchent des horaires de marché structurés et des positions à long terme.
4. Puis-je trader le forex et les actions en même temps ?
Oui, de nombreux traders choisissent de diversifier en tradant à la fois le forex et les actions. Cette approche permet d’équilibrer les risques et d’exploiter différentes opportunités selon les conditions du marché.
5. Comment la liquidité diffère-t-elle entre le forex et les actions ?
Le marché forex est le plus liquide au monde, avec des milliers de milliards de dollars échangés chaque jour. Bien que certaines actions, surtout celles de grandes capitalisations, soient aussi liquides, la liquidité varie davantage selon les titres.
6. Le trading forex est-il plus volatil que le trading d’actions ?
Le trading forex connaît souvent une volatilité à court terme plus élevée due aux actualités économiques, événements géopolitiques et politiques des banques centrales. Le trading d’actions peut également être volatil, notamment pendant la saison des résultats, mais le forex est généralement plus rapide.